

Below are highlights from the 2023 Victorian Skills Authority Employer Satisfaction Survey.
Visit our Employer Satisfaction Survey page for the most recent results and find out more about the VSA annual survey program.
Downloadable 2023 survey highlights
Download the survey highlights as a PDF.
Accessible 2023 survey highlights
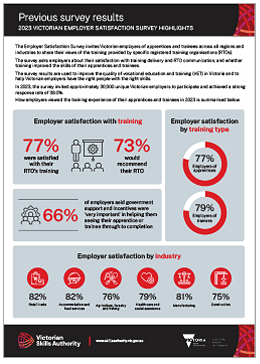
The Employer Satisfaction Survey invites Victorian employers of apprentices and trainees across all regions and industries to share their views of the training provided by specific registered training organisations (RTOs).
The survey asks employers about their satisfaction with training delivery and RTO communication, and whether training improved the skills of their apprentices and trainees.
The survey results are used to improve the quality of vocational education and training (VET) in Victoria and to help Victorian employers have the right people with the right skills.
In 2023, the survey invited approximately 30,000 unique Victorian employers to participate and achieved a strong response rate of 38%.
How employers viewed the training experience of their apprentices and trainees in 2023 is summarised below.
Employer satisfaction with training
- 77%
- were satisfied with their RTO's training
- 73%
- would recommend their RTO
66% of employers said government support and incentives were 'very important' in helping them seeing their apprentice or trainee through to completion.
Employer satisfaction by training type
- 77%
- employers of apprentices were satisfied
- 79%
- employers of trainees were satisfied
Employer satisfaction by industry
The proportion of employers who were satisfied with the level of training given to their apprentices and trainees, broken down by industry.
- 82%
- Retail trade
- 82%
- Accommodation and food services
- 76%
- Agriculture, forestry and fishing, and mining
- 79%
- Health care and social assistance
- 81%
- Manufacturing
- 75%
- Construction
Updated