

June 2024
Notable market developments
- Prices for recovered tin-plate steel cans and aluminium beverage cans have recovered strongly over the last three years. They are trading at relatively high levels across 2023 and 2024, coming off price peaks around March 2022. Prices decreased from the very high prices seen in the first half of 2022, were strong across 2023 and then decreased slightly into 2024.
- Exports of tin plate steel cans and aluminium beverage cans has softened. Exported quantities grew steadily from mid-2022 through to mid-2023 high before dropping back slightly. Scrap metal cans continue to trade at relatively high levels.
Material overview and market summary
Steel and aluminium cans account for a small fraction of overall metals recovery in Victoria. These materials can now only be recovered through container deposit scheme and household kerbside recycling collections.
Almost all recovered metal packaging is sold into export markets, with no Victorian tin-plated steel or aluminium packaging identified as being reprocessed in Australia. This is due both to the low level of interest in this material locally, and the strong markets internationally.
Figure 1 provides data on the change in exports of kerbside recovered metal packaging since the start of 2017. Exported quantities are closely tied to international market exchange prices, which generally explains the variability in exports across the years, as proponents stockpile metals until higher prices are available. Recovered metals exports were relatively high at the start of 2023–24 but fell across the financial year.
Figure 1: Destination of Victorian MRF outputs (tonnes per month) – metal packaging

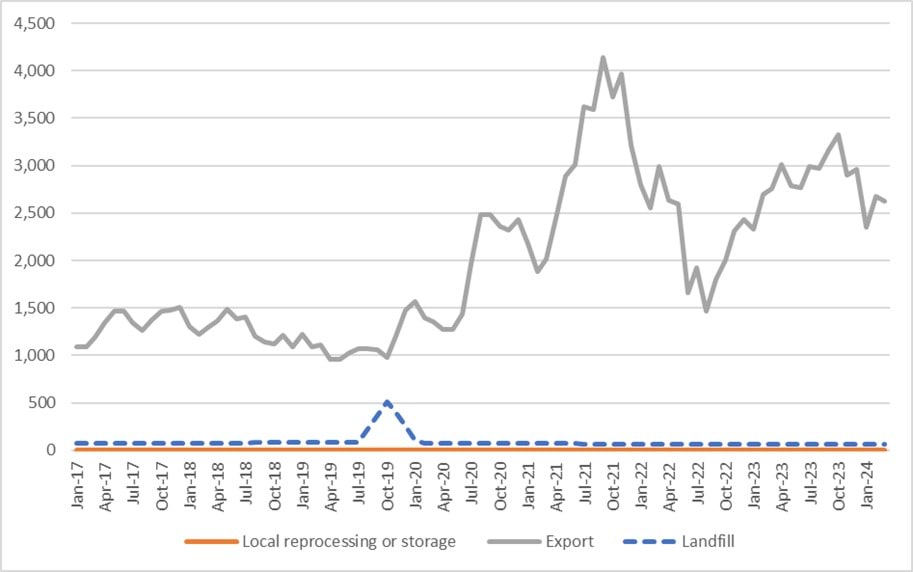
From June 2023 until March 2024, baled steel and aluminium packaging was sent to different countries, the main destinations were India, Thailand, South Korea, Malaysia and Indonesia.
There are trials of small quantities of tin-plated and aluminium packaging reported as reprocessed in other states, and it is expected that these quantities will increase over coming years.
Prices, demand and supply
International markets for steel and aluminium packaging remain strong despite little steel or aluminium packaging post-consumer reprocessed in Australia.
The price of steel packaging is linked to global steel pricing. The price received in March 2024 for baled steel packaging was close to $330 per tonne (out-the-gate or Ex Works (EXW) of materials recovery facility (MRFs)). This is considered relatively strong in context of the long-term trend. Although higher values were observed around the second quarter of 2023–24. This was $420–$480 per tonne in August to November 2023.
The price of shipped aluminium packaging is linked to virgin aluminium pricing. In March 2024, the price received for baled aluminium beverage cans was approximately $1,900–$2,000 per tonne (EXW MRF). The previous financial year of 2022–23 held prices of approximately $2,000–$2,200 per tonne.
New national capacity for aluminium beverage cans is minor relative to national generation of this material.
There remains no reported significant distressed storage of steel or aluminium packaging.
Key end markets and related specifications
Exported steel packaging has specifications relating to contamination levels and bale density. The sorting that is undertaken at MRFs allows the baled material to meet these specifications without major difficulty or manual sorting input. A similar situation exists for aluminium packaging.
Export and interstate market review
Exported steel and aluminium packaging are sold into large markets with most metal coming from non-packaging sources. The material flows from all countries is destined for wherever the demand requires material for production. Unlike some other materials, there is no way of knowing the origin of the steel or aluminium in new product. Demand and pricing can increase or decrease based on worldwide supply and demand conditions.
Exports of kerbside recovered metal packaging increased steadily from July 2022 to July 2023, before trending down during the year to date (figure 2), with a slight softening of exports (table 1 and 2) and prices.
Over the first half of 2024 container prices to southeast Asian destinations such as Malaysia, Indonesia and South Korea have risen modestly, with global increases continuing to flow through, leading to ongoing pressure on outbound freight costs.
Figure 2: Victorian recovered kerbside metal packaging, to export country (tonnes per month)

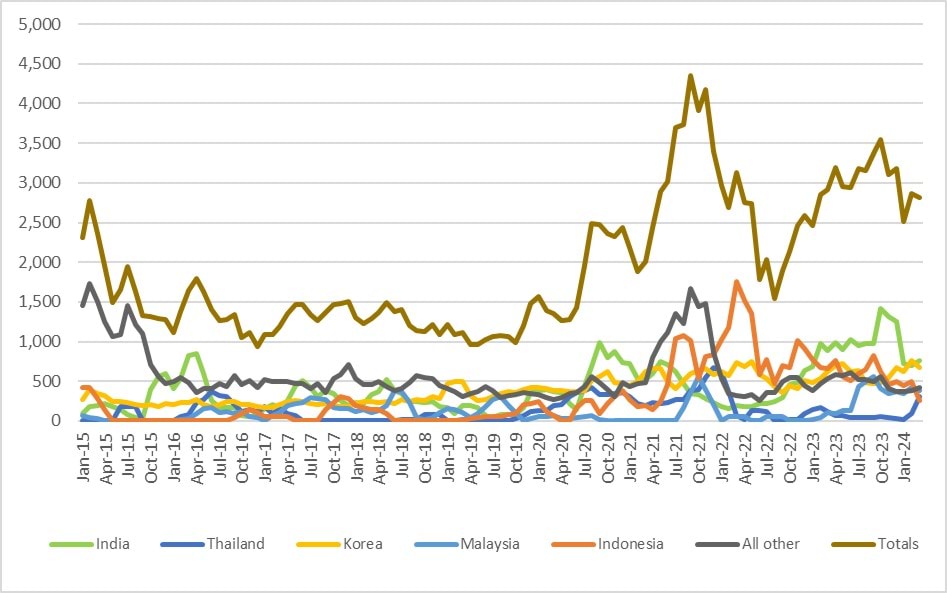
Table 1: Annual Victorian recovered kerbside recovered metals, to export country
| Country* | 2015–16 (tonnes) | 2016–17 (tonnes) | 2017–18 (tonnes) | 2018–19 (tonnes) | 2019–20 (tonnes) | 2020–21 (tonnes) | 2021–22 (tonnes) | 2022–23 (tonnes) | 2023-24** (tonnes) |
|---|---|---|---|---|---|---|---|---|---|
Country* India | 2015–16 (tonnes) 5,200 | 2016–17 (tonnes) 2,400 | 2017–18 (tonnes) 4,000 | 2018–19 (tonnes) 2,400 | 2019–20 (tonnes) 2,700 | 2020–21 (tonnes) 8,400 | 2021–22 (tonnes) 3,400 | 2022–23 (tonnes) 7,800 | 2023-24** (tonnes) 9,100 |
Country* Thailand | 2015–16 (tonnes) 1,400 | 2016–17 (tonnes) 1,800 | 2017–18 (tonnes) 0 | 2018–19 (tonnes) 400 | 2019–20 (tonnes) 1,500 | 2020–21 (tonnes) 3,600 | 2021–22 (tonnes) 3,900 | 2022–23 (tonnes) 800 | 2023-24** (tonnes) 600 |
Country* Korea | 2015–16 (tonnes) 2,600 | 2016–17 (tonnes) 2,600 | 2017–18 (tonnes) 2,600 | 2018–19 (tonnes) 3,900 | 2019–20 (tonnes) 4,500 | 2020–21 (tonnes) 6,400 | 2021–22 (tonnes) 7,300 | 2022–23 (tonnes) 6,300 | 2023-24** (tonnes) 5,300 |
Country* Malaysia | 2015–16 (tonnes) 500 | 2016–17 (tonnes) 1,400 | 2017–18 (tonnes) 2,400 | 2018–19 (tonnes) 1,500 | 2019–20 (tonnes) 1,200 | 2020–21 (tonnes) 200 | 2021–22 (tonnes) 1,900 | 2022–23 (tonnes) 700 | 2023-24** (tonnes) 3,800 |
Country* Indonesia | 2015–16 (tonnes) 0 | 2016–17 (tonnes) 600 | 2017–18 (tonnes) 1,700 | 2018–19 (tonnes) 200 | 2019–20 (tonnes) 1,300 | 2020–21 (tonnes) 3,000 | 2021–22 (tonnes) 12,700 | 2022–23 (tonnes) 8,500 | 2023-24** (tonnes) 4,900 |
Country* All other | 2015–16 (tonnes) 8,200 | 2016–17 (tonnes) 5,800 | 2017–18 (tonnes) 5,800 | 2018–19 (tonnes) 5,200 | 2019–20 (tonnes) 3,900 | 2020–21 (tonnes) 7,000 | 2021–22 (tonnes) 10,100 | 2022–23 (tonnes) 5,900 | 2023-24** (tonnes) 4,100 |
Country* Total | 2015–16 (tonnes) 17,900 | 2016–17 (tonnes) 14,600 | 2017–18 (tonnes) 16,500 | 2018–19 (tonnes) 13,600 | 2019–20 (tonnes) 15,100 | 2020–21 (tonnes) 28,600 | 2021–22 (tonnes) 39,300 | 2022–23 (tonnes) 30,000 | 2023-24** (tonnes) 27,800 |
Source: ABS and IE (Australian Harmonized Export Commodity Classification (AHECC) data by month, classification, and destination country, 2024) and Blue Environment.
* Countries ranked by average of last 3 months of exports.
** Partial year across March 2024.
Table 2: Most recent monthly change in Victorian recovered metals, to export country
| Country | February 2024 (tonnes) | March 2024 (tonnes) | Change (%) |
|---|---|---|---|
Country Indonesia | February 2024 (tonnes) 700 | March 2024 (tonnes) 800 | Change (%) 14% |
Country India | February 2024 (tonnes) 100 | March 2024 (tonnes) 300 | Change (%) 200% |
Country Korea | February 2024 (tonnes) 800 | March 2024 (tonnes) 700 | Change (%) -13% |
Country Malaysia | February 2024 (tonnes) 400 | March 2024 (tonnes) 400 | Change (%) 0% |
Country Taiwan | February 2024 (tonnes) 500 | March 2024 (tonnes) 300 | Change (%) -40% |
Country All other | February 2024 (tonnes) 400 | March 2024 (tonnes) 400 | Change (%) 0% |
Country Total | February 2024 (tonnes) 2,900 | March 2024 (tonnes) 2,900 | Change (%) 0% |
Source: ABS and IE (Australian Harmonized Export Commodity Classification (AHECC) data by month, classification, and destination country, 2024) and Blue Environment.
Market opportunities
Commodity values continue to be driven by international values, with the global steel and aluminium markets consistently able to absorb metal packaging from kerbside collections, better than the local or global markets for any of the other packaging materials. This remains primarily due to the lack of barriers in returning MRF sourced metal packaging back into the global scrap pool and then into many steel and aluminium products beyond packaging.
As noted previously, if there was a markedly negative shift in supply/demand at a global level, this could lead to significant price reductions for baled steel, which may in turn, impact local reprocessing capacity in Australia.
Report disclaimer
The information in this report was prepared in conjunction with Blue Environment.
While reasonable efforts have been made to ensure that the contents of this publication are factually correct, Recycling Victoria gives no warranty regarding its accuracy, completeness, currency, or suitability for any particular purpose and to the extent permitted by law, does not accept any liability for loss or damages incurred as a result of placed upon the content of this publication.
This publication is provided on the basis that all persons accessing it undertake responsibility for assessing the relevance and accuracy of its content.
Recycling Victoria does not accept any liability for loss or damage arising from your use of or reliance on the Data. The inclusion of information in this report does not constitute Recycling Victoria’s endorsement of any facility, or any associated organisation, product, or service.
Accessibility disclaimer
The Victorian Government is committed to providing a website that is accessible to the widest possible audience, regardless of technology or ability.
This page contains 2 embedded complex image files (Figures 1 and 2) that may not meet our minimum WCAG AA Accessibility standards.
If you are unable to read any of the content of this page, you can contact the content owners for an accessible version.
Contact email: rvdata@deeca.vic.gov.au
Updated