Performance against key bushfire risk management targets
The government funds FFMVic through DEECA to reduce the impact of major bushfires on people, property and the environment. Performance is measured against the indicators captured in Table 9.
In 2023-24, FFMVic met or exceeded 12 of 13 of its key performance measures for bushfire risk management on public land
Table 9: Key FFMVic bushfire risk management performance measures 2023-24.
Performance measures | Unit of measure | 2022-23 Actual | 2023-24 Target | 2023-24 Actual | Performance variance relative to target % | Result |
|---|---|---|---|---|---|---|
| Mitigation and planning | ||||||
| Stakeholder and community forums on bushfire management and planned burning held. | # | 13 | 12 | 14 | +17% | Y |
| Proportion of Community-Based Bushfire Management partnerships rated as high functioning. | % | 80 | 80 | 80% | 0% | Y |
| Statewide [fuel-driven] bushfire risk is maintained at or below the target. | % | 65 | 70 | 64% | +6% | Y |
| 100% of burns identified in the Joint Fuel Management Program prepared for delivery. ** | date | Sept 2022 | Feb 2024 | Apr 2024 | % | Y |
| Preparedness | ||||||
| New strategic fuel breaks constructed. * | km | N/A | 34 km | 37 km | +8.5% | Y |
| Strategic fuel breaks maintained. | km | N/A | 900 | 941 km | +4.5% | Y |
| Strategic fire access roads improved. | km | 2,155 | 2,000 | 2,082 km | +4% | Y |
| Bridges or crossings on the strategic fire access road network replaced or upgraded. | # | 10 | 10 | 10 | 0% | Y |
| Personnel with accreditation is a fire and emergency management role. | # | 2,747 | 2,450 | 2,949 | +20% | Y |
| Personnel accredited to serve in a senior capacity (level 2 or 3) in a fire and emergency management role. | # | 379 | 340 | 352 | 4% | Y |
| State forests roads (Category 1) and bridges (on Category 1 roads) with documented inspections and/or maintenance programs to meet regulatory obligations. | % | 100 | 100 | 100% | 0% | Y |
| Response | ||||||
| Fires contained at less than five hectares to suppress fires before they become established, minimising impact. | % | 92.4% | 80% | 92% | +16% | Y |
| Fires contained at first attack to suppress fires before they become established, minimising impact | % | 97.7% | 80% | 96% | +16% | Y |
Note:
| Y | Performance target achieved or exceeded |
| N | Performance target not achieved – within 5 per cent variance |
*Total does not include the 22.7km of strategic fuel breaks upgraded as “upgraded” is not included in the BP3 measure.
** Performance is below target due to above average rainfall during December 2023 and January 2024, and resource impacts from bushfire response and storm damage in February 2024, which led to a two-month delay in the preparation and planning of burns identified in the JFMP.
Fuel management performance
Planned burning and non-burn fuel treatment
Under the Forests Act 1958, DEECA is responsible for the planned prevention of fire in State forests, National Parks and other protected public land in Victoria. It does this through FFMVic, which is led by DEECA and draws on partnership arrangements with Parks Victoria and Melbourne Water.
The Code of Practice for Bushfire Management on Public Land 2012 specifies the objectives of fuel management and informs the planning and delivery of fuel management on public land. The program aims to meet the dual objectives of the impacts of major bushfires on communities and other assets and values, and maintaining or improving the resilience of natural ecosystems.
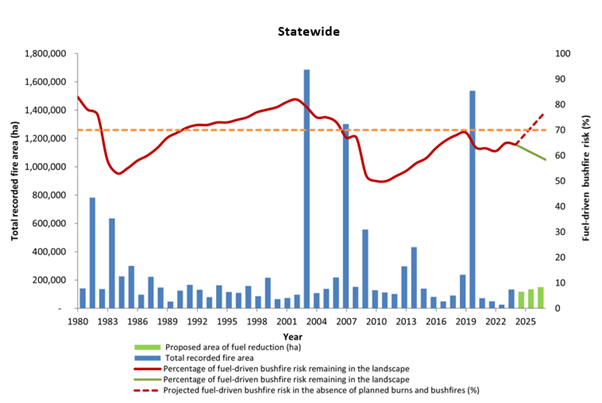
FFMVic’s fuel management target is to maintain statewide fuel-driven bushfire risk to human life and property at or below 70% of Victoria’s potential maximum level through fuel management in State forests, national parks and other protected public land. Statewide fuel-driven bushfire risk on 30 June 2024 was 64%, which achieves the target.
Figure 1 indicates that if the JFMP is implemented in full, and there is no bushfire activity, fuel-driven bushfire risk will remain below 70%. In the absence of fire (from planned burning or bushfires) the modelling indicates that fuel-driven bushfire risk would rise to 77% over the next three years.
Snapshot of FFMVics statewide outcomes and delivery, 2023–24
An overview of FFMVic’s statewide outcomes and delivery for 2023–24 is shown in Table 10.
Changes to reported State risk calculations from 2022-23 are shown in Appendix 1.
Table 10: Snapshot of FFMVics statewide outcomes and delivery, 2023–24.
| Performance Measures | Unit of measure | 2021-22 Actual | 2022-23 Actual | 2023-24 Target | 2023-24 Actual |
|---|---|---|---|---|---|
| Outcome: Statewide fuel-driven bushfire risk | % | 62% | 65% | 70% | 64% |
| Activity: Total area treated with fuel management. | ha | 77,927 ha | 92,257 ha | n/a | 138,454 ha |
| Activity: Cross-tenure burns. | # | 32 | 22 | n/a | 30 |
| Activity: Cross-tenure burns. | ha | 16,981 ha | 10,282 ha | n/a | 19,767 ha |
| Activity: 100% of burns identified in the Joint Fuel Management Program prepared for delivery. | date | n/a | Sept 2022 | Feb 2024 | Apr 2024 |
| Outcome: Vegetation on public land within tolerable fire interval. | % | 23% | 28% | n/a | 30% |
| Outcome: Vegetation on public land in the mature and old growth stages. | % | 37% | 38% | n/a | 39% |
| Investment: Total investment in FFMVic fuel management program. | $M | $151 | $141.1 | n/a | $159.5 |
The 2023-24 FFMVic fuel management program delivered 1,926 fuel management operations treating a total of 138,454 hectares. This included 316 planned burns treating 122,291 hectares and 1,610 non-burn fuel treatments treating 16,163 hectares.
The majority of planned burns (244 burns) were undertaken for the primary purpose of bushfire risk reduction, and 37 planned burns were delivered with the primary objective of improving ecological resilience outcomes. Table 11 summarises FFMVic’s statewide fuel management program over the past two financial years.
Table 11: Statewide fuel management delivery, 2022-23 to 2023-24.
Fuel management statewide | 2022-23 | 2023-24 | ||
|---|---|---|---|---|
Total hectares | Total Number of treatments | Total hectares | Total Number of treatments | |
Area treated by planned burning Ecological burns Risk reduction burns Windrow / heap | 75,500 ha 11,802 ha 63,628 ha 70 ha | 214 28 144 42 | 122,291 ha 3,864 ha 118,386 ha 41 ha | 316 37 244 35 |
Area treated by non-burn fuel treatments * Mechanical mulching Mechanical slashing or mowing Other methods | 16,757 ha 2,469 ha 10,460 ha 3,826 ha | 1,602 193 1,319 90 | 16,163 ha 3,475 ha 9,221 ha 3,467 ha | 1,610 274 1,256 80 |
| Total area treated | 92,257 ha | 1,816 | 138,454 ha | 1,926 |
*Total area includes storm debris treatments of 279ha.
Planned burn ignition opportunities
FFMVic considers when conditions are favourable to deliver planned burning safely and effectively and utilises appropriate burning windows to deliver the planned burning program. Most of the planned burning program continues to be delivered in autumn, when weather conditions are typically more stable, there is lower risk of extreme fire danger days, and the fuel conditions are appropriate to achieve the desired burn objective. Under these conditions, fire behaviour is generally more manageable and predictable.
In 2023–24, FFMVic planned 445 burns for delivery as a part of Year 1 of the JFMP and ignited 316 (71%) of these burns. This compares with the 2022–23 year when 381 burns were planned to be delivered in Year 1 of the JFMP and 234 (61%) were ignited.
215 of the 445 planned burns listed on Year 1 of the JFMP for 2023–24 were identified by FFMVic as priority planned burns for reducing bushfire risk. This prioritisation focusses FFMVic’s efforts on the burns that deliver the greatest risk reduction when conditions are suited for broad program delivery. In 2023–24, 138 (64%) of the identified 215 priority burns were ignited, this is higher compared to the 76 (46%) of the identified 166 priority burns that went ahead in 2022–23. It is however slightly lower than the overall proportion of the program delivered, FFMVic advise that it is reflective of the fact that priority burns are often closer to communities, infrastructure, and industry and are therefore more difficult to schedule while being mindful to community impacts.
During 2023-24 of the 445 burns planned to be delivered, 386 were scheduled for ignition at least once. There was no suitable scheduling opportunity identified for the remainder of the Year 1 program due to weather, fuel conditions, response to emergency activities and other program constraints. On average, each scheduled burn was rescheduled 5 times across the year; 17 burns were scheduled over 10 times, and one up to 27 times, demonstrating the amount of effort that is committed to finding the right opportunities to deliver burns safely and effectively. FFMVic worked closely with communities, stakeholders, and other government agencies – including the Environment Protection Authority and Department of Health – to minimise the smoke impacts of planned burns on communities. This included scheduling burns in weather conditions that minimised impact, or rescheduling burns to outside peak holiday times.
Table 12 provides a snapshot of FFMVic planned burn planning, scheduling and delivery, 2023–24.
Table 12: Snapshot of FFMVic planned burn planning, scheduling and delivery, 2022-23 to 2023-24.
| Number and proportion of burns by stage | 2022-23 | 2023-24 |
|---|---|---|
| Planned | 381 | 445 |
| Scheduled | 335 (88%) | 386 (87%) |
| Delivered | 234 (61%) | 316 (71%) |
| Delivered on first scheduling | N/A | 20 (4%) |
| Rescheduled at least once | N/A | 296 (67%) |
| Scheduled and not delivered | 101 (27%) | 79 (18%) |
| Priority Burns identified (from total planned) | 166 (44%) | 215 (48%) |
| Priority burns delivered (from total identified as priority) | 76 (20%) | 138 (64%) |
Insights about the reasons why some burns were not ignited can be gained from the Burn Opportunity Reporting Tool (BORT).
In 2021, FFMVic released the prototype Burn Opportunity Reporting Tool (BORT) to track ignition opportunities on a day-by-day basis and assess whether weather conditions provided an opportunity to ignite each burn as originally planned. The tool is partly automated and requires some manual review for accuracy. Table 13 indicates the reasons why planned burns were not ignited as recorded in BORT.
Table 13: Factors influencing the delivery of planned burns in 2023–24 using the Burn Opportunity Reporting Tool (BORT).
| Factors influencing delivery | 2021-22* | 2022-23 | 2023-24 |
|---|---|---|---|
Proportion (%) | Proportion (%) | Proportion (%) | |
| Weather conditions not suitable | 52.7% | 64% | 57.5% |
| Weather prescription window occurred prior to completion of burn planning or preparation | n/a | 24% | 14.3% |
| Possible missed opportunity | n/a | 5.4% | 8.5% |
| Fuel conditions not suitable | 18.8% | 6% | 8.0% |
| Undefined | n/a | 0% | 7.4% |
| Operation risk too high | n/a | 0.3% | 2.7% |
| Bushfires and other emergencies | n/a | 0% | 0.8% |
| Other | 5.1% | 0.04% | 0.4% |
| Resource availability during peak delivery period | n/a | 0.04% | 0.3% |
| Financial considerations | n/a | 0.2% | 0.1% |
| Burn planning or burn preparation not completed in time | 26.2% | n/a | n/a |
| Resources unavailable | 1% | n/a | n/a |
| Environment, community, stakeholder related | 0.6% | n/a | n/a |
| Total | 100% | 100% | 100% |
*Note: Updates to the BORT reporting tool, including the addition of reasons for changes in factors influencing delivery, were implemented after the 2021-22 reporting period. As a result, the data on factors influencing delivery is not directly comparable with subsequent years.
The BORT tool indicates that in most cases, ignition opportunities were limited by:
- weather conditions being unsuitable (57.5%),
- planning or preparation of the burn not being completed in time (14.3%), or
- fuels (vegetation) not being suitable to meet the objectives of the burn (8.0%).
In 8.5% of cases, BORT recorded a possible missed opportunity for a burn ignition, where weather conditions were within prescription, and burns were listed as ‘Ready’ (planning and preparation complete). However, this figure is likely an overestimate due to the automated nature of the tool and limited manual interpretation. For example, some opportunities were flagged during winter months when fuels are typically too wet for burns to proceed.
BORT assesses every burn on Year 1 of the JFMP each day for suitable weather conditions for delivery. In many cases narrow opportunities are identified which may not be sufficient for the size of the operation. In others, whist there may be a weather window, fuel conditions on the ground may be too wet or too dry. The reporting system automatically considers this a potentially missed opportunity, requiring manual interpretation of whether in fact the weather conditions were suitable for a particular burn.
If the burn has not reached a standard where it’s considered Ready then the reason for the missed opportunity is recorded as ‘Weather prescription window occurred prior to completion of burn planning or preparation’ regardless of whether the weather conditions were suitable.
Automated reasons can be manually overwritten in BORT, but when staff are deployed to fires, floods or delivery of planned burns this data validation step can be missed. This is an area of improvement for future versions of the reporting tool.
While the prototype tool is not yet refined enough to consistently distinguish all underlying constraints, it has the potential to provide valuable insights into the challenges faced in delivering FFMVic’s planned burning program. These might include the need to improve readiness, better account for fuel conditions, and refine prioritisation to maximise opportunities within operational constraints.
Cross-tenure burning
FFMVic’s fuel management program is strengthened by the Victorian Government’s Safer Together program, which ensures that DEECA, including FFMVic, works in partnership with the CFA, Fire Rescue Victoria (FRV), DTP, councils and other sector partners to support integrated, evidence-based bushfire risk management across all public and private land in Victoria.
In 2023–24, FFMVic led the delivery of 30 cross-tenure planned burns treating 19,767 hectares. Most of these burns were regionally critical due to them being aligned to regional Bushfire Management Strategies and providing high levels of risk reduction value.
The majority of FFMVic led cross-tenure burns in 2023-24 were delivered in the Gippsland region (11 cross-tenure burns across 13,875 hectares). Table 14 provides a regional overview of cross-tenure planned burns.
Table 14: Cross-tenure planned burns led by FFMVic, by region, 2021-22 to 2023-24.
| Region | 2021–22 | 2022–23 | 2023-24 | |||
|---|---|---|---|---|---|---|
No. burns | Hectares | No. burns | Hectares | No. burns | Hectares | |
| Barwon South West | 12 | 9,172 ha | 14 | 1,512 ha | 10 | 956 ha |
| Gippsland | 5 | 3,858 ha | 3 | 5,408 ha | 11 | 13,875 ha |
| Grampians | 6 | 1,031 ha | 2 | 2,908 ha | 1 | 49 ha |
| Hume | 1 | 2,693 ha | 1 | 419 ha | 2 | 4,664 ha |
| Loddon Mallee | 0 | 0 | 0 | 0 | 0 | 0 |
| Port Phillip | 8 | 227 ha | 2 | 37 ha | 6 | 224 ha |
| Total | 32 | 16,981 ha | 22 | 10,282 ha* | 30 | 19,767 ha* |
*Figures don’t tally due to rounding.
Strategic fuel breaks
DEECA’s Strategic Fuel Breaks program maintains and expands the network of strategic fuel breaks across Victoria to reduce the risk and impact of bushfires near high priority locations close to townships, key assets, water catchments and sensitive environments, and in parts of the landscape advantageous to support bushfire suppression and reduction in the size of fires.
Strategic fuel breaks are a strip of land where vegetation has been permanently modified to reduce the rate of spread and intensity of fire for the direct protection of assets and/or assist fire suppression.
In 2022-23, the Strategic Fuel Break Program completed its initial phase of creating new strategic fuel breaks. The focus has now shifted to maintaining these breaks, which is crucial for their long-term effectiveness.
In 2023–24, DEECA invested $2.2 million (Table 22) constructing 37 km of strategic fuel breaks across the state. Table 15 summarises the total kilometres of strategic fuel breaks built in each region over the past four financial years.
Table 15: Total kilometres of strategic fuel breaks built in each region from 2021-24.
| Region | 2020-21 | 2021-22 | 2022-23 | 2023-24 | Total |
|---|---|---|---|---|---|
| Barwon South West | 28.1 km | 66.4 km | n/a | 0 | 94.5 km |
| Gippsland | 361.4 km | 202.4 km | 87.8 km | 8.5 km | 660.1 km |
| Grampians | n/a | 27.9 km | n/a | 0 | 27.9 km |
| Hume | 134.7 km | 160.7 km* | 95.7 km | 26.2 km | 363.3 km |
| Loddon Mallee | n/a | 141 km | 4.4 km | 0 | 145.4 km |
| Port Phillip | n/a | 131.1 km | 46.9 km | 2.2 km | 180.2 km |
| Regions Total | 524 km | 730 km | 235 km** | 37 km | 1,471 km |
*This figure has been altered from the 2022-23 report which contained a typing error. It was 106.7, it should have been 160.7. This table includes corrects figures and the column now adds up.
In addition, a total of 22.7 km of strategic fuel breaks were upgraded throughout the state, entirely within the Port Phillip Region. Table 16 summarises the total kilometres of strategic fuel breaks upgraded in each region between 2023-24 financial year.
Table 16: Total kilometres of strategic fuel break upgrade in each region.
| Region | Number of completed treatments | 2023-24 |
|---|---|---|
| Barwon South West | 0 | 0 |
| Gippsland | 0 | 0 |
| Grampians | 0 | 0 |
| Hume | 0 | 0 |
| Loddon Mallee | 0 | 0 |
| Port Phillip | 2 | 22.7 km |
| Regions Total | 2 | 22.7 km |
A total of 941 km of strategic fuel breaks were maintained across the state in 2023-24. The Gippsland Region led the strategic fuel break maintenance efforts with 604 km, followed by the Hume Region (189 km), Barwon South West Region (106 km), Port Phillip Region (34 km), and Grampians Region (7.5 km). No strategic fuel break maintenance was performed in the Loddon Mallee Region. Table 17 summarises the total kilometres of strategic fuel breaks maintained in each region in the 2023-24 financial year.
Table 17: Total kilometres of strategic fuel break maintenance in each region, 2023-24.
| Region | Number of completed treatments | 2023-24 |
|---|---|---|
| Barwon South West | 49 | 106.5 km |
| Gippsland | 35 | 604.1 km |
| Grampians | 1 | 7.5 km |
| Hume | 13 | 189 km |
| Loddon Mallee | 0 | 0.0 |
| Port Phillip | 4 | 33.9 km |
| Regions Total | 102 | 941 km |
Ecosystem resilience
A primary objective of FFMVic’s bushfire management program is to maintain or improve the resilience of natural ecosystems and their ability to deliver services such as biodiversity, water, carbon storage and forest products.
FFMVic’s bushfire risk management program supports this objective by reducing the impact of major bushfires on environmental assets and ecosystems and introducing planned fire into landscapes that require it for regeneration of fire-dependent species and other ecological objectives.
FFMVic’s bushfire management program delivered a net improvement in ecological resilience outcomes against the two key ecological resilience measures (Table 18 and Table 19).
In 2023-24, the area of public land vegetation within its TFI increased to 30% (up from 28% in 2022-23). Approximately 47% of vegetation on public land in Victoria remains below its minimum TFI, showing an improvement in this category (down from 49% in 2022–23).
Table 18: Tolerable Fire Interval - Statewide, 2021-22 to 2023-24.
| Tolerable Fire Interval | Unit | 2021-22 | 2022-23 | 2023-24 | Trend |
|---|---|---|---|---|---|
| Below minimum TFI | % | 54% | 49% | 47% | ¯ |
| Within TFI | % | 23% | 28% | 30% | |
| Above maximum TFI | % | 2% | 2% | 3% | |
| No fire history | % | 21% | 21% | 21% | - |
| Total | % | 100% | 100% | 100% |
|
Note: Continual improvement in fire mapping may lead to small discrepancies in previously reported percentage values. All figures reported here, including comparison to the previous year, are calculated using the most accurate mapping available.
The proportion of vegetation on public land in the mature (35%) and adolescent (27%) growth stages increased while the proportion in the juvenile stage (13%) decreased. The area of vegetation in the oldest growth stage (4%) remained the same.
Table 19: Growth Stage Structure - Statewide, 2021-22 to 2023-24.
| Growth Stage Structure | Unit | 2021-22 | 2022-23 | 2023-24 | Trend |
|---|---|---|---|---|---|
| Juvenile growth stage | % | 23% | 15% | 13% | ¯ |
| Adolescent growth stage | % | 18% | 26% | 27% | |
| Mature growth stage | % | 34% | 34% | 35% | |
| Old growth stage | % | 4% | 4% | 4% | - |
| No fire history | % | 21% | 21% | 21% | - |
| Total | % | 100% | 100% | 100% |
|
Note: Continual improvement in fire mapping may lead to small discrepancies in previously reported percentage values. All figures reported here, including comparison to the previous year, are calculated using the most accurate mapping available.
Although ecosystem resilience measures are demonstrating improvement, the area of vegetation below minimum TFI and in the earlier growth stages is still too high due to the impacts of the 2019–20 bushfires.
In 2023-24, FFMVic conducted 37 planned burns across 3,846 hectares (Table 11) for the primary purpose of improving ecological outcomes.
FFMVic also partnered with universities and other academic institutions to conduct research that improves how ecosystem resilience is represented and measured.
Changes to reported ecosystem resilience calculations from previous years are shown in Appendix 2.
Victorian Bushfire Monitoring Program
In 2023–24, the Monitoring, Evaluation and Reporting Framework for Bushfire Management on Public Land continued to be delivered through the Victorian Bushfire Monitoring Program (VBMP). This included monitoring fuel levels, ecosystem resilience measures, research projects and location-specific activities to support improvement.
The data from monitoring enables DEECA, including FFMVic, to understand how effectively planned burning reduces bushfire fuels and evaluate performance in reducing fuel-driven bushfire risk.
Fuel hazard monitoring
Fuel hazard monitoring provides important information about:
- planned burns, including the severity and coverage of each burn
- how each planned burn has reduced fuel hazard
- the success of each planned burn in achieving ecological burn objectives where appropriate, and
- whether follow-up actions are required.
Burn objectives are set to achieve a balance between fuel reduction and preserving important values. For example, a burn objective may be to achieve 70% burn coverage within the footprint of a planned burn to ensure that sufficient refugia, habitat and food sources are left for flora and fauna.
When evaluating a planned burn, a series of plots are measured. In 2023–24 a total of 2,542 sites were monitored for pre- and post-burn treatment fuel hazard.
Funding for fuel management research totalled $2.1 million. Table 20 summaries the total number of fuel hazard sites monitored, pre and post burn, across the state.
Table 20: Fuel hazard sites monitored, by region, Victoria, 2023–24.
| Region | Number of pre-burn sites | Number of post-burn sites | Other | Total |
|---|---|---|---|---|
| Barwon South West | 291 | 531 | 0 | 822 |
| Gippsland | 160 | n/a | 200* | 360 |
| Grampians | 0 | 0 | 0 | 0 |
| Hume | 433 | 381 | 0 | 814 |
| Loddon Mallee | 96 | 122 | 0 | 218 |
| Port Phillip | 243 | 85 | 0 | 328 |
| State-wide total | 1,223 | 1,119 | 200 | 2,542 |
*This includes 200 permanent monitoring sites located in Asset Protection Zones in Gippsland. These sites are monitored whether they are burnt or not. Of these sites, 54 were in the Black Summer fire area.
Ecosystem resilience monitoring
To understand the effects of both bushfires and planned burning on the environment, FFMVic measures and monitors the timing and number of fires in different types of vegetation. FFMVic’s fuel management program considers how best to meet the two primary objectives of minimising the impact of major bushfires; and maintaining or improving the resilience of natural ecosystems.
FFMVic also partners with universities and other academic institutions to conduct research that improves how ecosystem resilience is represented and measured. In 2023–24, FFMVic continued to deliver the statewide ecosystem resilience monitoring program in partnership with Natural Hazards Research Australia, Museums Victoria and the University of Melbourne. To date, DEECA has invested more than $7 million in this monitoring program, which is collecting data on habitat structure, flora, birds and mammals in 11 priority ecological fire groups across the state. Victoria now has data for all 11 of the highest priority ecological fire groups, providing opportunities to replace expert datasets with empirically derived data in models and decision making. This monitoring program is providing scientific evidence and recommendations for fire management and planning, improving the ecological basis underpinning Victoria’s ecosystem resilience metrics and future monitoring and research.
Investment
FFMVic invested $159.5 million in fuel management in 2023–24, reflecting a 12% increase from $141.1 million invested in 2022–23. Direct fuel management investment totalled $36.6 million, while indirect investment amounted to $123 million. Table 21 provides a breakdown of fuel management investment by region and type.
Table 21: FFMVic fuel management investment, by region and group, Victoria, 2022–24.
| 2022-2023 | 2023-2024 | ||||
|---|---|---|---|---|---|---|
| Region | Fuel management ($ direct) | Fuel management ($ indirect) | Total ($) | Fuel management ($ direct) | Fuel management ($ indirect) | Total ($) |
| Barwon South West | $3.7m | $7.0m | $10.7m | $7.1m | $9.7m | $16.8m |
| Gippsland | $4.5m | $18.8m | $23.3m | $6.4m | $17.8m | $24.2m |
| Grampians | $3.8m | $8.2m | $12.1m | $3.1m | $8.6m | $11.7m |
| Hume | $4.0m | $16.0m | $20.0m | $9.4m | $16.5m | $25.9m |
| Loddon Mallee | $2.6m | $9.5m | $12.1m | $5.3m | $10.3m | $15.5m |
| Port Phillip | $2.7m | $7.3m | $10.0m | $4.2m | $9.2m | $13.4m |
| Statewide | $2.8m | $48.7m | $51.4m | $1.0m | $50.9m | $52.0m |
Total fuel management investment | $24.1m | $117m* | $141.1m* | $36.6m | $123.m | $159.5m |
*Totals include $1.5 million invested in research.
Note: that total values are calculated from raw data for accuracy and are rounded (using the Rounding Guidelines) from two decimal places. As an artefact of this rounding, the total values listed differ from the total of the individual line values.
In 2023-24, direct investment in FFMVic’s fuel management activities has increased significantly since the previous year. This was due to a significant increase in investment in planned burning ($31.7m) to take advantage of favourable weather conditions for delivering an expanded burning program. Investment in strategic fuel breaks ($2.2m) and non-burn fuel treatment ($2.7m) decreased from last financial year. Table 22 provides a detailed breakdown of direct investments by fuel management treatment for the past three financial years.
Table 22: Comparison of FFMVic direct investment in fuel management treatments from 2021-24.
Treatment cost ($m) | 2021–22 | 2022–23 | 2023–24 |
|---|---|---|---|
| Non-burn fuel treatment | $2.0m | $2.9m | $2.7m |
| Planned burning | $24.0m | $13.9m | $31.7m |
| Strategic fuel breaks | $11.3m | $7.2m | $2.2m |
Total | $37.3m | $24.1m | $36.6m |
Investment in strategic fuel breaks declined over the past three financial years, following the conclusion of the Strategic Fuel Break Program in 2022-23. In 2023-24, the focus shifted to maintaining existing strategic fuel breaks rather than establishing new ones. Table 23 outlines the investment in strategic fuel breaks over the last three financial years.
Table 23: Investment in strategic fuel breaks by region from 2021-22 to 2023-24.
Cost of strategic fuel break construction ($m) | 2021–22 | 2022–23 | 2023–24 |
|---|---|---|---|
| Barwon South West | $0.7m | $0.6m | $0.09m |
| Gippsland | $1.2m | $1.1m | $0.29m |
| Grampians | $0.1m | $0.2m | $0m |
| Hume | $2.5m | $1.2m | $0.2m |
| Loddon Mallee | $0.6m | $0.4m | $0.02m |
| Port Phillip | $1.5m | $1.0m | $0.98m |
| Forest and Fire Operations Division | $4.5m | $2.7m | $0.64m |
Total | $11.1m | $7.2m | $2.2m |
Note: This table has been rounded as per the Rounding Guidelines for 2023-24, this is inconsistent with the approach used in previous years.
Investment in indirect costs increased by around 7% in 2023-24. A significant portion of indirect fuel management costs is attributed to resource management (40%) and equipment/infrastructure (19%). The rise in resource management expenses is primarily due to the extension of Project Fire Fighters (PFFs) required for the expanded planned burn program delivered. Additionally, funding for equipment and infrastructure increased, largely due to higher expenditures on Fit for Purpose Technology Systems ($4.3 million) and Fuel Management Roading Management ($2 million).
Table 24 provides a detailed breakdown of indirect investments by item for the past two financial years.
Table 24: Indirect fuel management investment, by items, Victoria 2022–2024.
| Item | 2022-2023 | 2023-2024 | ||
|---|---|---|---|---|
Indirect investment (%) | Total ($M) | Indirect investment (%) | Total ($M) | |
| Business management | 5% | $6m | 7% | $8.5m |
| Capability | 11% | $12.5m | 12% | $14.6m |
| Engagement | 8% | $9.2m | 6% | $7.9m |
| Equipment and infrastructure | 16% | $18.7m | 19% | $23.7m |
| Monitoring, evaluation and reporting | 8% | $9m | 7% | $8.9m |
| Operational planning | 5% | $5.6m | 1% | $1.1m |
| Resource Management | 41% | $47.0m | 40% | $49.9m |
| Strategic Planning | 7% | $7.5m | 7% | $8.2m |
| Research* | n/a | $1.5m | 2% | $2.1m |
| Total indirect investment | 100% | $117m | 100 % | $124.9m |
*Current financial systems methods do not allow for separation between types of grants allocated for research or other purposes. Research expenditure is calculated and reported manually as a stand-alone figure.
Note: that total values are calculated from raw data for accuracy and are rounded (using the Rounding Guidelines) from two decimal places. As an artefact of this rounding, the total values listed differ from the total of the individual line values.
Updated