

The strong labour market has made it easier for more Victorians to get jobs. As a result, unemployment rates for Victorians that have historically faced complex and structural barriers to employment, such as women, young people, mature-aged workers, and early school leavers are below the average for the prior decade. However, the unemployment rates for young people and women have risen since 2023. The rise in youth unemployment is consistent with previous periods when labour demand has eased.
Figure 1.4
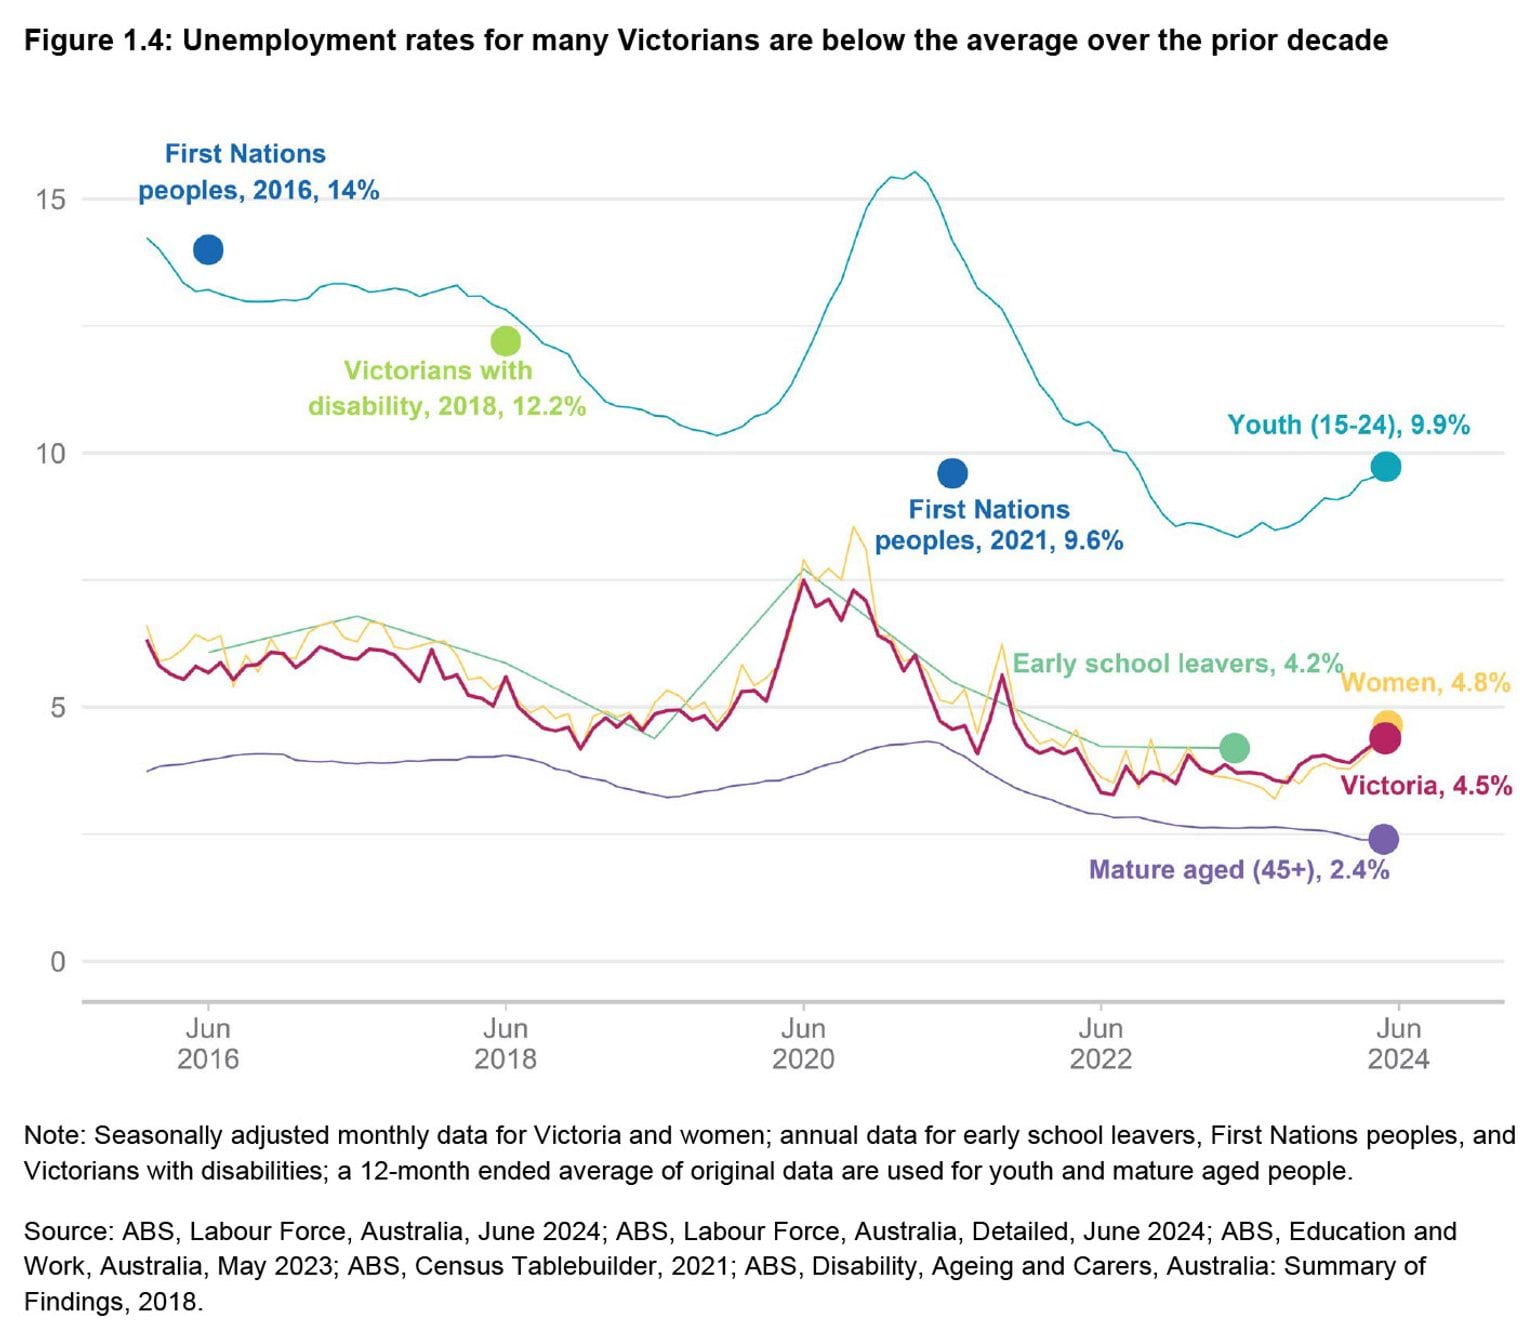
Figure 1.4: Unemployment rates for many Victorians are below the average over the prior decade
Unemployment rate (%)
Victoria Youth (15-24) Early school leavers Mature aged (45+) Women First Nations peoples Victorians with disability Jan-2016 6.3 14.2 3.7 6.6 Feb-2016 5.8 14.0 3.8 5.9 Mar-2016 5.6 13.7 3.9 6.0 Apr-2016 5.5 13.3 3.9 6.2 May-2016 5.8 13.2 3.9 6.4 Jun-2016 5.7 13.2 6.1 4.0 6.3 14.0 Jul-2016 5.9 13.1 4.0 6.4 Aug-2016 5.5 13.1 4.0 5.4 Sep-2016 5.8 13.0 4.1 6.0 Oct-2016 5.8 13.0 4.1 5.7 Nov-2016 6.1 13.0 4.1 6.4 Dec-2016 6.1 13.0 4.1 6.0 Jan-2017 5.8 13.0 4.0 6.0 Feb-2017 6.0 13.0 3.9 6.5 Mar-2017 6.2 13.3 3.9 6.6 Apr-2017 6.1 13.3 3.9 6.7 May-2017 6.0 13.3 3.9 6.4 Jun-2017 5.9 13.3 6.8 3.9 6.3 Jul-2017 6.1 13.2 3.9 6.7 Aug-2017 6.1 13.2 3.9 6.6 Sep-2017 6.0 13.2 3.9 6.2 Oct-2017 5.8 13.2 3.9 6.1 Nov-2017 5.5 13.1 3.9 6.2 Dec-2017 6.1 13.2 4.0 6.3 Jan-2018 5.6 13.2 4.0 6.3 Feb-2018 5.6 13.3 4.0 6.0 Mar-2018 5.2 13.1 4.0 5.6 Apr-2018 5.2 13.1 4.0 5.6 May-2018 5.0 12.9 4.0 5.3 Jun-2018 5.6 12.8 5.9 4.1 5.5 12.2 Jul-2018 5.0 12.6 4.0 5.1 Aug-2018 4.8 12.4 4.0 4.9 Sep-2018 4.6 12.2 3.9 5.0 Oct-2018 4.5 12.1 3.8 4.8 Nov-2018 4.6 11.9 3.7 4.9 Dec-2018 4.2 11.5 3.6 4.1 Jan-2019 4.6 11.3 3.6 4.8 Feb-2019 4.8 11.0 3.5 4.9 Mar-2019 4.6 10.9 3.4 4.8 Apr-2019 4.8 10.9 3.4 4.9 May-2019 4.5 10.9 3.3 4.6 Jun-2019 4.9 10.7 4.4 3.3 5.1 Jul-2019 4.9 10.7 3.2 5.3 Aug-2019 4.9 10.6 3.2 5.2 Sep-2019 4.7 10.5 3.3 4.9 Oct-2019 4.8 10.4 3.3 5.1 Nov-2019 4.6 10.3 3.4 4.7 Dec-2019 4.9 10.4 3.4 5.0 Jan-2020 5.3 10.5 3.5 5.8 Feb-2020 5.3 10.7 3.5 5.4 Mar-2020 5.1 10.8 3.6 5.6 Apr-2020 5.9 11.0 3.6 5.8 May-2020 6.7 11.3 3.6 6.6 Jun-2020 7.5 11.8 7.7 3.7 7.9 Jul-2020 7.0 12.4 3.8 7.5 Aug-2020 7.1 12.9 3.9 7.7 Sep-2020 6.7 13.4 3.9 7.4 Oct-2020 7.3 14.1 4.0 8.5 Nov-2020 7.1 14.8 4.1 8.1 Dec-2020 6.4 15.2 4.2 6.4 Jan-2021 6.3 15.4 4.3 6.4 Feb-2021 5.7 15.4 4.3 5.9 Mar-2021 6.0 15.5 4.3 6.0 Apr-2021 5.3 15.3 4.3 5.7 May-2021 4.7 14.8 4.3 5.1 Jun-2021 4.6 14.2 5.5 4.1 5.1 9.6 Jul-2021 4.6 13.8 4.0 5.4 Aug-2021 4.1 13.3 3.9 4.5 Sep-2021 4.8 13.0 3.7 5.3 Oct-2021 5.6 12.8 3.6 6.2 Nov-2021 4.7 12.3 3.4 5.0 Dec-2021 4.2 11.9 3.3 4.6 Jan-2022 4.1 11.3 3.2 4.3 Feb-2022 4.2 11.0 3.2 4.4 Mar-2022 4.1 10.7 3.1 4.2 Apr-2022 4.2 10.5 3.0 4.6 May-2022 3.8 10.6 2.9 3.9 Jun-2022 3.3 10.4 4.2 2.9 3.6 Jul-2022 3.3 10.1 2.8 3.5 Aug-2022 3.8 10.0 2.8 4.1 Sep-2022 3.5 9.7 2.8 3.3 Oct-2022 3.7 9.1 2.8 4.3 Nov-2022 3.7 8.8 2.7 3.6 Dec-2022 3.5 8.6 2.7 3.8 Jan-2023 4.1 8.6 2.6 4.2 Feb-2023 3.8 8.6 2.6 3.8 Mar-2023 3.7 8.5 2.6 3.7 Apr-2023 3.9 8.4 2.6 3.6 May-2023 3.7 8.3 2.6 3.6 Jun-2023 3.7 8.5 4.2 2.6 3.5 Jul-2023 3.7 8.6 2.6 3.4 Aug-2023 3.6 8.5 2.6 3.2 Sep-2023 3.5 8.5 2.6 3.6 Oct-2023 3.9 8.6 2.6 3.5 Nov-2023 4.0 8.9 2.6 3.8 Dec-2023 4.1 9.1 2.6 3.9 Jan-2024 4.0 9.1 2.5 3.8 Feb-2024 3.9 9.2 2.4 3.8 Mar-2024 4.1 9.4 2.4 4.0 Apr-2024 4.3 9.5 2.4 4.2 May-2024 4.4 9.7 2.4 4.6 Jun-2024 4.5 9.9 2.4 4.8 Note: Seasonally adjusted monthly data for Victoria and women; annual data for early school leavers, First Nations peoples, and Victorians with disabilities; a 12-month ended average of original data are used for youth and mature aged people.
Source: ABS, Labour Force, Australia, June 2024; ABS, Labour Force, Australia, Detailed, June 2024; ABS, Education and Work, Australia, May 2023; ABS, Census Tablebuilder, 2021; ABS, Disability, Ageing and Carers, Australia: Summary of Findings, 2018.
- Download 'Figure 1.4'
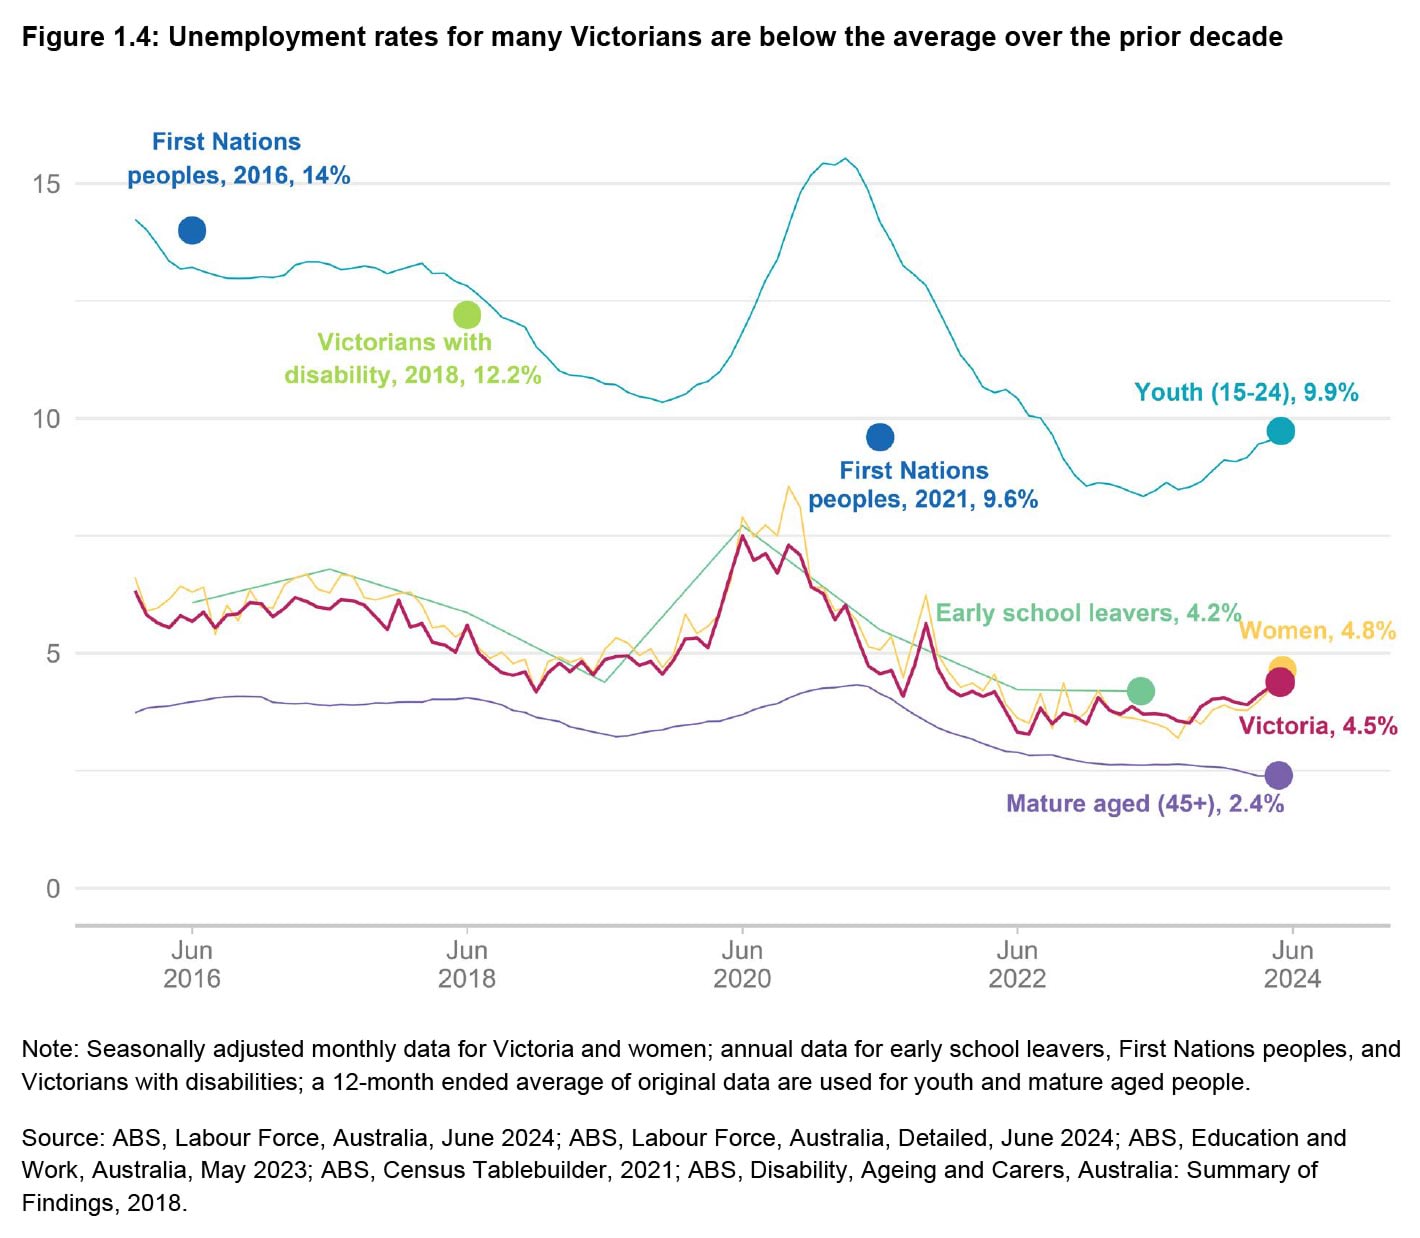
The long-term unemployment rate (people who have been searching for work for 12 months or more) has increased slightly but is still low by historical standards.
Figure 1.5

Figure 1.5: The long-term unemployment rate remains low by historical standards
By duration of job search, 12 month ended average
Unemployment rate (%)
Under 3 months 3-12 months 12 months
or moreJun-2005 2.8 1.5 1.1 Jul-2005 2.9 1.5 1.1 Aug-2005 2.8 1.5 1.1 Sep-2005 2.8 1.5 1.1 Oct-2005 2.8 1.5 1.0 Nov-2005 2.8 1.5 1.0 Dec-2005 2.8 1.5 1.0 Jan-2006 2.8 1.5 1.0 Feb-2006 2.8 1.5 1.0 Mar-2006 2.8 1.5 1.0 Apr-2006 2.7 1.5 1.0 May-2006 2.7 1.5 1.0 Jun-2006 2.7 1.5 1.0 Jul-2006 2.7 1.5 1.0 Aug-2006 2.7 1.5 1.0 Sep-2006 2.7 1.5 1.0 Oct-2006 2.7 1.4 0.9 Nov-2006 2.7 1.4 0.9 Dec-2006 2.7 1.4 0.9 Jan-2007 2.7 1.4 0.9 Feb-2007 2.7 1.4 0.8 Mar-2007 2.7 1.4 0.8 Apr-2007 2.7 1.4 0.8 May-2007 2.7 1.4 0.8 Jun-2007 2.7 1.4 0.7 Jul-2007 2.6 1.4 0.7 Aug-2007 2.7 1.4 0.7 Sep-2007 2.6 1.4 0.7 Oct-2007 2.6 1.4 0.7 Nov-2007 2.6 1.4 0.7 Dec-2007 2.6 1.4 0.7 Jan-2008 2.6 1.4 0.7 Feb-2008 2.5 1.4 0.7 Mar-2008 2.5 1.3 0.7 Apr-2008 2.5 1.3 0.7 May-2008 2.5 1.3 0.7 Jun-2008 2.6 1.3 0.6 Jul-2008 2.6 1.3 0.6 Aug-2008 2.6 1.3 0.6 Sep-2008 2.6 1.3 0.6 Oct-2008 2.6 1.3 0.6 Nov-2008 2.6 1.2 0.6 Dec-2008 2.6 1.2 0.6 Jan-2009 2.6 1.2 0.6 Feb-2009 2.8 1.2 0.6 Mar-2009 2.8 1.3 0.6 Apr-2009 2.9 1.3 0.6 May-2009 2.9 1.4 0.6 Jun-2009 2.9 1.5 0.7 Jul-2009 2.9 1.6 0.7 Aug-2009 2.9 1.7 0.7 Sep-2009 2.9 1.7 0.8 Oct-2009 2.9 1.8 0.8 Nov-2009 2.9 1.8 0.8 Dec-2009 2.9 1.9 0.9 Jan-2010 2.9 1.9 0.9 Feb-2010 2.8 1.9 0.9 Mar-2010 2.8 1.9 0.9 Apr-2010 2.7 1.9 0.9 May-2010 2.7 1.9 1.0 Jun-2010 2.7 1.8 1.0 Jul-2010 2.7 1.8 1.0 Aug-2010 2.7 1.7 1.0 Sep-2010 2.7 1.7 1.0 Oct-2010 2.7 1.7 1.0 Nov-2010 2.7 1.6 1.0 Dec-2010 2.7 1.6 1.0 Jan-2011 2.7 1.6 1.0 Feb-2011 2.7 1.6 1.0 Mar-2011 2.7 1.5 1.0 Apr-2011 2.6 1.5 1.0 May-2011 2.6 1.5 1.0 Jun-2011 2.6 1.5 0.9 Jul-2011 2.6 1.5 0.9 Aug-2011 2.6 1.5 0.9 Sep-2011 2.6 1.5 0.9 Oct-2011 2.6 1.5 0.9 Nov-2011 2.6 1.5 0.9 Dec-2011 2.6 1.5 0.9 Jan-2012 2.6 1.5 0.9 Feb-2012 2.7 1.5 0.9 Mar-2012 2.8 1.5 1.0 Apr-2012 2.8 1.5 1.0 May-2012 2.8 1.5 1.0 Jun-2012 2.8 1.6 1.0 Jul-2012 2.9 1.6 1.0 Aug-2012 2.9 1.6 0.9 Sep-2012 2.9 1.6 0.9 Oct-2012 2.9 1.6 0.9 Nov-2012 2.9 1.6 1.0 Dec-2012 2.9 1.6 0.9 Jan-2013 3.0 1.7 1.0 Feb-2013 3.0 1.7 0.9 Mar-2013 3.0 1.7 1.0 Apr-2013 3.0 1.7 0.9 May-2013 3.0 1.7 0.9 Jun-2013 3.0 1.8 0.9 Jul-2013 2.9 1.8 1.0 Aug-2013 2.9 1.8 1.0 Sep-2013 2.9 1.8 1.0 Oct-2013 2.9 1.8 1.0 Nov-2013 3.0 1.9 1.0 Dec-2013 3.0 1.9 1.0 Jan-2014 3.0 1.9 1.0 Feb-2014 3.0 2.0 1.1 Mar-2014 3.0 2.0 1.1 Apr-2014 3.0 2.0 1.1 May-2014 3.0 2.0 1.2 Jun-2014 3.0 2.0 1.2 Jul-2014 3.0 2.1 1.2 Aug-2014 3.0 2.1 1.3 Sep-2014 3.1 2.2 1.3 Oct-2014 3.1 2.2 1.3 Nov-2014 3.1 2.2 1.3 Dec-2014 3.2 2.2 1.3 Jan-2015 3.1 2.2 1.3 Feb-2015 3.1 2.2 1.3 Mar-2015 3.1 2.1 1.3 Apr-2015 3.1 2.1 1.3 May-2015 3.1 2.1 1.3 Jun-2015 3.1 2.1 1.3 Jul-2015 3.1 2.1 1.3 Aug-2015 3.0 2.0 1.3 Sep-2015 3.0 2.0 1.3 Oct-2015 2.9 2.0 1.3 Nov-2015 2.9 2.0 1.3 Dec-2015 2.9 2.0 1.2 Jan-2016 2.9 2.0 1.2 Feb-2016 2.9 2.0 1.2 Mar-2016 2.8 2.0 1.2 Apr-2016 2.8 2.0 1.2 May-2016 2.8 2.0 1.2 Jun-2016 2.7 2.0 1.2 Jul-2016 2.7 2.0 1.2 Aug-2016 2.7 2.0 1.2 Sep-2016 2.6 2.0 1.2 Oct-2016 2.6 2.0 1.2 Nov-2016 2.6 2.0 1.2 Dec-2016 2.6 2.0 1.2 Jan-2017 2.6 2.0 1.2 Feb-2017 2.6 2.0 1.2 Mar-2017 2.6 2.0 1.2 Apr-2017 2.7 2.0 1.2 May-2017 2.7 2.0 1.2 Jun-2017 2.7 2.0 1.2 Jul-2017 2.7 2.0 1.2 Aug-2017 2.7 2.0 1.2 Sep-2017 2.8 2.0 1.3 Oct-2017 2.8 2.0 1.2 Nov-2017 2.8 2.0 1.2 Dec-2017 2.8 1.9 1.2 Jan-2018 2.8 1.9 1.2 Feb-2018 2.8 1.9 1.2 Mar-2018 2.7 1.9 1.2 Apr-2018 2.7 1.9 1.2 May-2018 2.6 1.8 1.2 Jun-2018 2.7 1.8 1.2 Jul-2018 2.6 1.8 1.2 Aug-2018 2.6 1.7 1.2 Sep-2018 2.5 1.7 1.1 Oct-2018 2.5 1.6 1.1 Nov-2018 2.5 1.6 1.1 Dec-2018 2.4 1.6 1.1 Jan-2019 2.4 1.5 1.0 Feb-2019 2.4 1.5 1.0 Mar-2019 2.4 1.5 1.0 Apr-2019 2.4 1.4 0.9 May-2019 2.4 1.4 0.9 Jun-2019 2.4 1.4 0.9 Jul-2019 2.4 1.4 0.9 Aug-2019 2.4 1.4 0.9 Sep-2019 2.4 1.4 0.9 Oct-2019 2.4 1.4 0.9 Nov-2019 2.4 1.4 0.9 Dec-2019 2.4 1.4 0.9 Jan-2020 2.4 1.4 1.0 Feb-2020 2.4 1.5 1.0 Mar-2020 2.4 1.5 1.0 Apr-2020 2.5 1.5 1.0 May-2020 2.7 1.5 1.0 Jun-2020 2.8 1.6 1.0 Jul-2020 2.9 1.7 1.0 Aug-2020 2.9 1.9 1.0 Sep-2020 2.9 2.0 1.0 Oct-2020 2.9 2.2 1.0 Nov-2020 2.9 2.4 1.0 Dec-2020 3.0 2.4 1.0 Jan-2021 3.0 2.5 1.0 Feb-2021 2.9 2.6 1.0 Mar-2021 2.9 2.6 1.0 Apr-2021 2.8 2.7 1.1 May-2021 2.6 2.7 1.1 Jun-2021 2.4 2.6 1.2 Jul-2021 2.4 2.4 1.2 Aug-2021 2.3 2.2 1.2 Sep-2021 2.4 2.0 1.2 Oct-2021 2.4 1.8 1.2 Nov-2021 2.4 1.6 1.2 Dec-2021 2.3 1.5 1.2 Jan-2022 2.3 1.4 1.2 Feb-2022 2.2 1.3 1.2 Mar-2022 2.2 1.2 1.1 Apr-2022 2.2 1.2 1.1 May-2022 2.2 1.2 1.0 Jun-2022 2.2 1.1 1.0 Jul-2022 2.1 1.1 1.0 Aug-2022 2.1 1.1 0.9 Sep-2022 2.1 1.1 0.9 Oct-2022 2.0 1.0 0.9 Nov-2022 2.0 1.0 0.8 Dec-2022 2.0 1.0 0.8 Jan-2023 2.0 1.0 0.8 Feb-2023 2.0 1.0 0.7 Mar-2023 2.0 1.0 0.7 Apr-2023 2.0 1.0 0.7 May-2023 2.0 1.0 0.7 Jun-2023 2.0 1.0 0.7 Jul-2023 2.1 1.0 0.7 Aug-2023 2.1 1.0 0.7 Sep-2023 2.1 1.0 0.7 Oct-2023 2.1 1.0 0.7 Nov-2023 2.1 1.0 0.7 Dec-2023 2.1 1.0 0.7 Jan-2024 2.1 1.0 0.7 Feb-2024 2.1 1.0 0.7 Mar-2024 2.1 1.1 0.7 Apr-2024 2.1 1.1 0.7 May-2024 2.1 1.1 0.7 Jun-2024 2.1 1.1 0.7 Source: ABS, Labour Force, Australia, Detailed, June 2024.
- Download 'Figure 1.5'
Unemployment in regional Victoria remains low compared to Greater Melbourne. 1 In part, the strength in regional labour markets reflects strong population growth and economic activity resulting in strong demand for labour. While unemployment in regional Victoria is low, the share of people in regional Victoria either working or actively looking for work (measured by the labour force participation rate) is lower than in Greater Melbourne.
Updated