

- Date:
- 29 Nov 2024
Key points
Current labour market conditions remain positive
Key Indicators – June 2024
| Unemployment rate | Labour force participation rate | Average weekly hours worked | Underemployment rate |
|---|---|---|---|
| 4.5% | 67.9% | 31.3 hours | 6.7% |
- The Victorian labour market is strong. The unemployment rate remains low by historical standards and the share of Victorians either working or actively looking for work is high.
- Part-time employment has increased and average hours worked has declined since early 2023. This is resulting in a higher share of people who have jobs but would like to work more hours (measured by the underemployment rate).
- Some workforce shortages show signs of easing, consistent with slowing vacancies, a pickup in applicants per vacancy and firms being able to fill vacant roles with less difficulty.
- Employability skills are growing in importance and are in high demand.
Many new workers are expected to enter the Victorian labour market in the next three years
- Around 392,000 new workers are expected to enter the Victorian workforce over the next three years to 2027, comprising of about 168,000 workers to fill new jobs and 224,000 workers to replace those who exit the workforce.
- Metropolitan Melbourne is expected to account for about four in five new workers over 2024-27 (or 315,000 new workers), with the remaining 77,000 new workers expected to enter the workforce in regional Victoria.
- Health care and social assistance is expected to lead industry workforce growth over the next three years. This industry, along with construction; professional scientific and technical services; and education and training, make up close to 60 per cent of new workers expected.
- Ageing and disability carers, registered nurses and construction managers are among the fastest growing occupations in Victoria.
- For the first time, this report also presents workforce projections for the next 10 years. Around 1,421,000 new workers are expected to gain employment over 2024-34. Most new workers (around 85 per cent) are expected to gain employment in occupations generally requiring post-secondary qualifications.
Victoria’s housing and infrastructure agenda is creating new job opportunities
- Victoria’s infrastructure commitments are a significant driver of workforce demand in construction and other industries in the supply chain over the next decade. Around 162,900 new workers are expected to join the workforce in construction alone over this period.
- Across the industry subdivisions within construction, most new workers are expected to enter construction services (95,600), followed by building construction (52,300) and heavy and civil engineering construction (15,000).
- Construction managers, electricians, carpenters and joiners, and plumbers are expected to be the most in-demand occupations in construction.
1. Current labour market conditions remain positive
This section details unemployment trends, workforce participation rates, and the four industries driving employment growth. It also shows that the strong labour market is reducing barriers for Victorians who are looking for work.
Unemployment is low
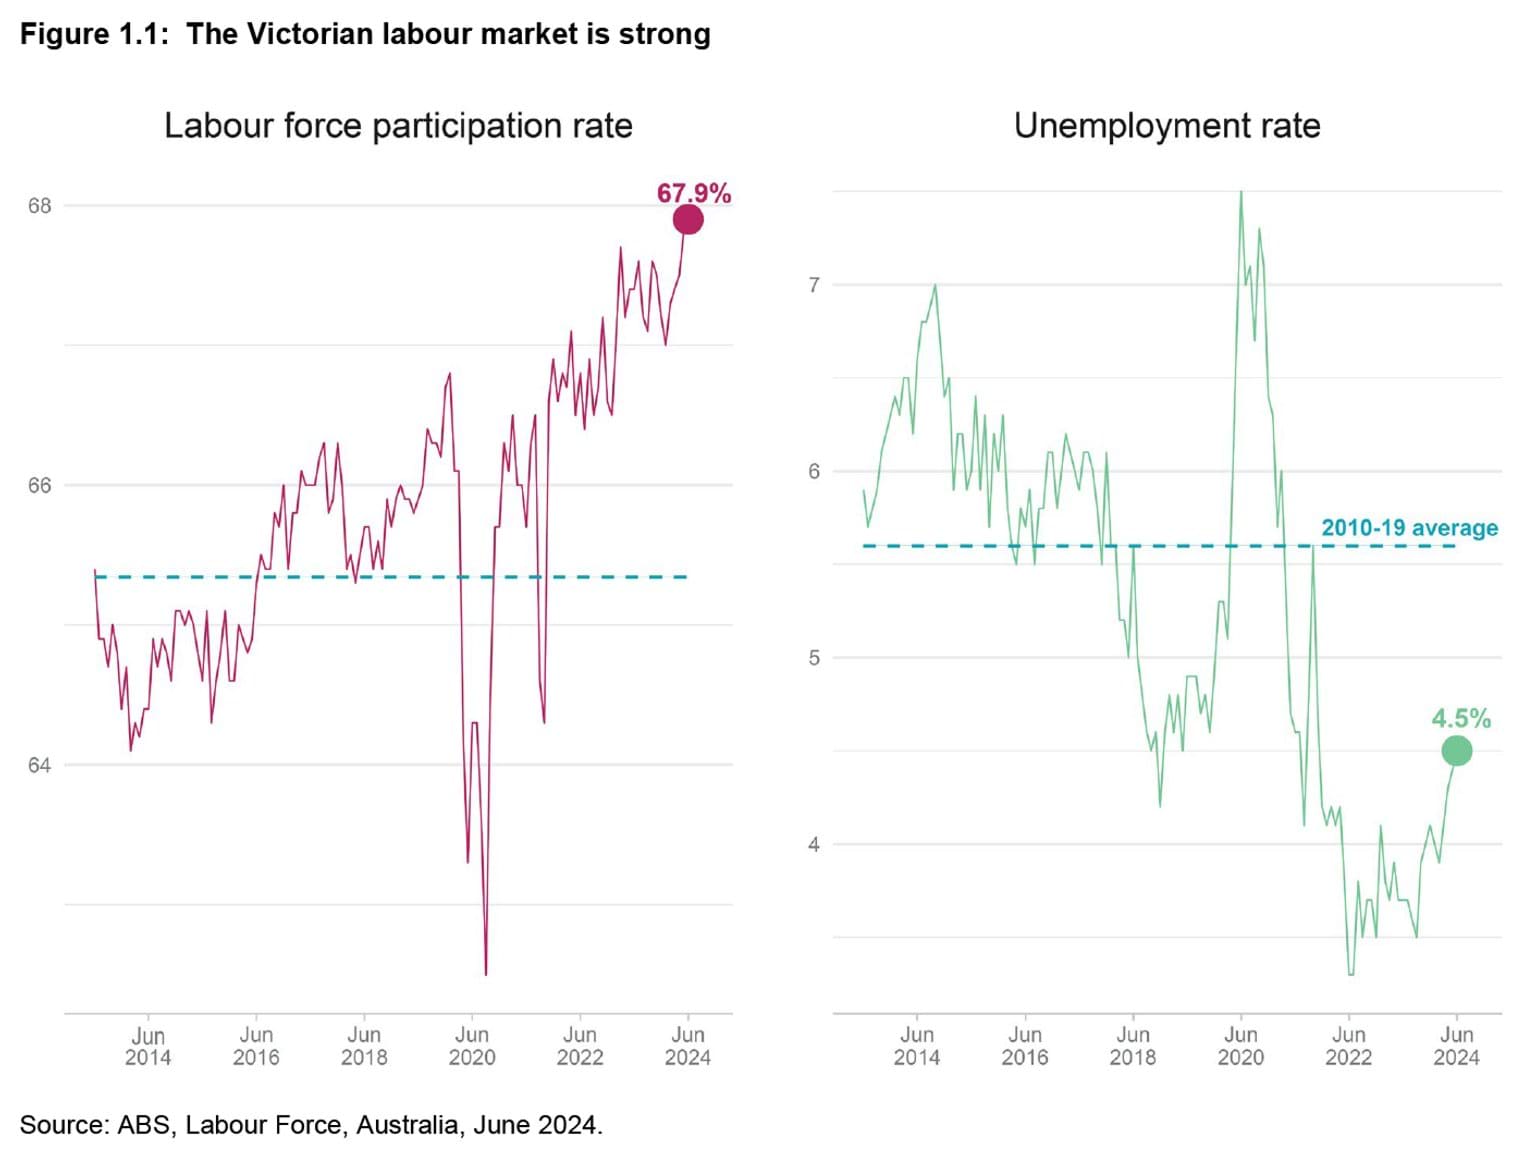
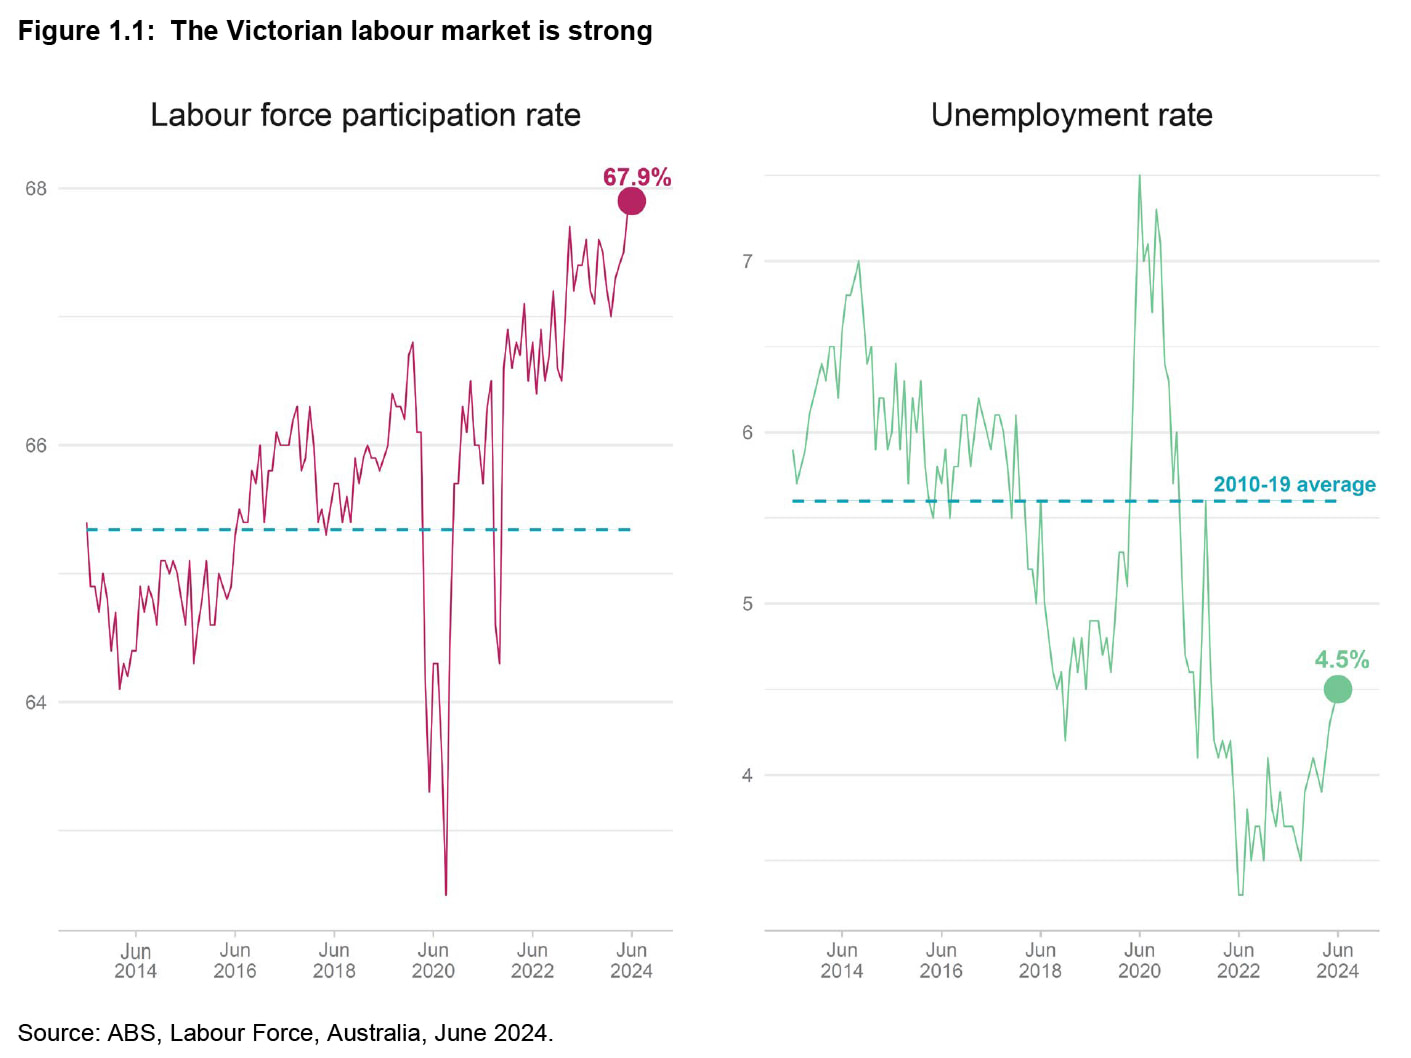
The unemployment rate has increased slightly since the start of 2024 but remains low by historical standards, with the current rate of 4.5 per cent well below the 2010-19 average of 5.6 per cent.
The share of Victorians either working or actively looking for work (measured by the labour force participation rate) is at a record high.
Figure 1.1
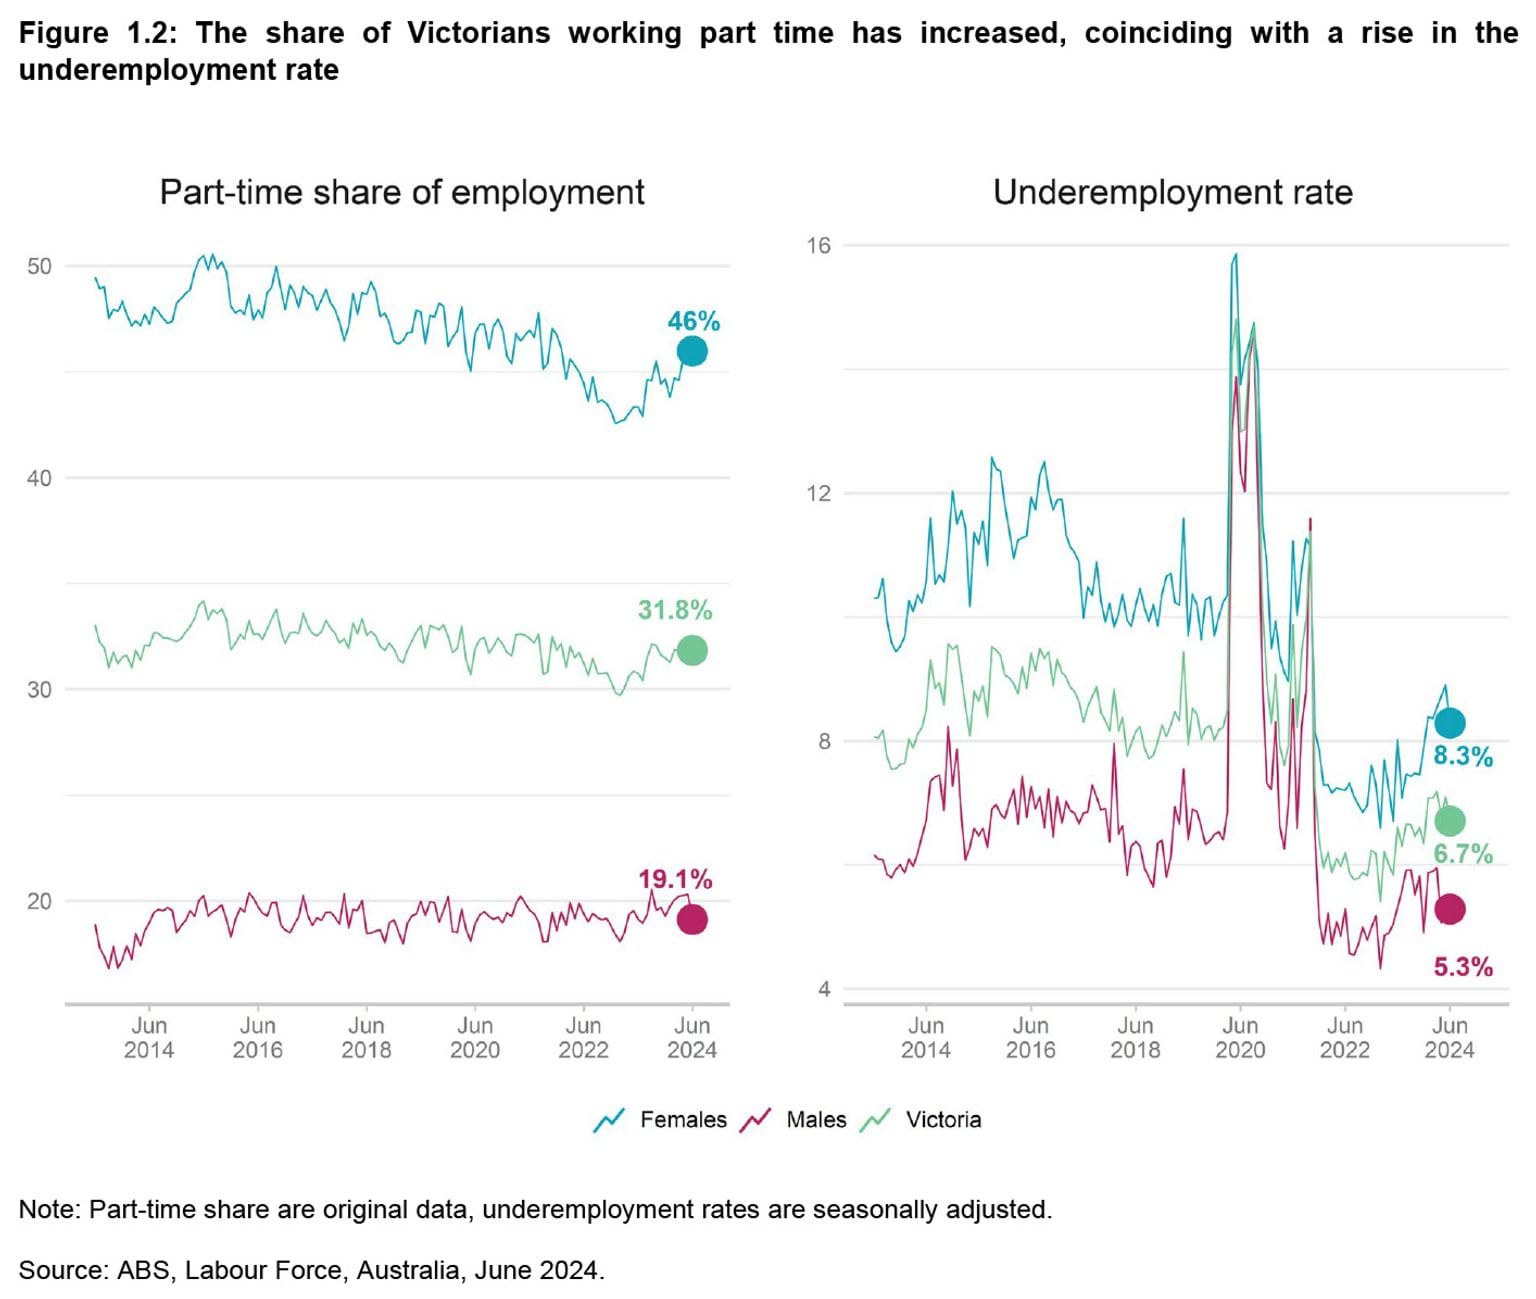
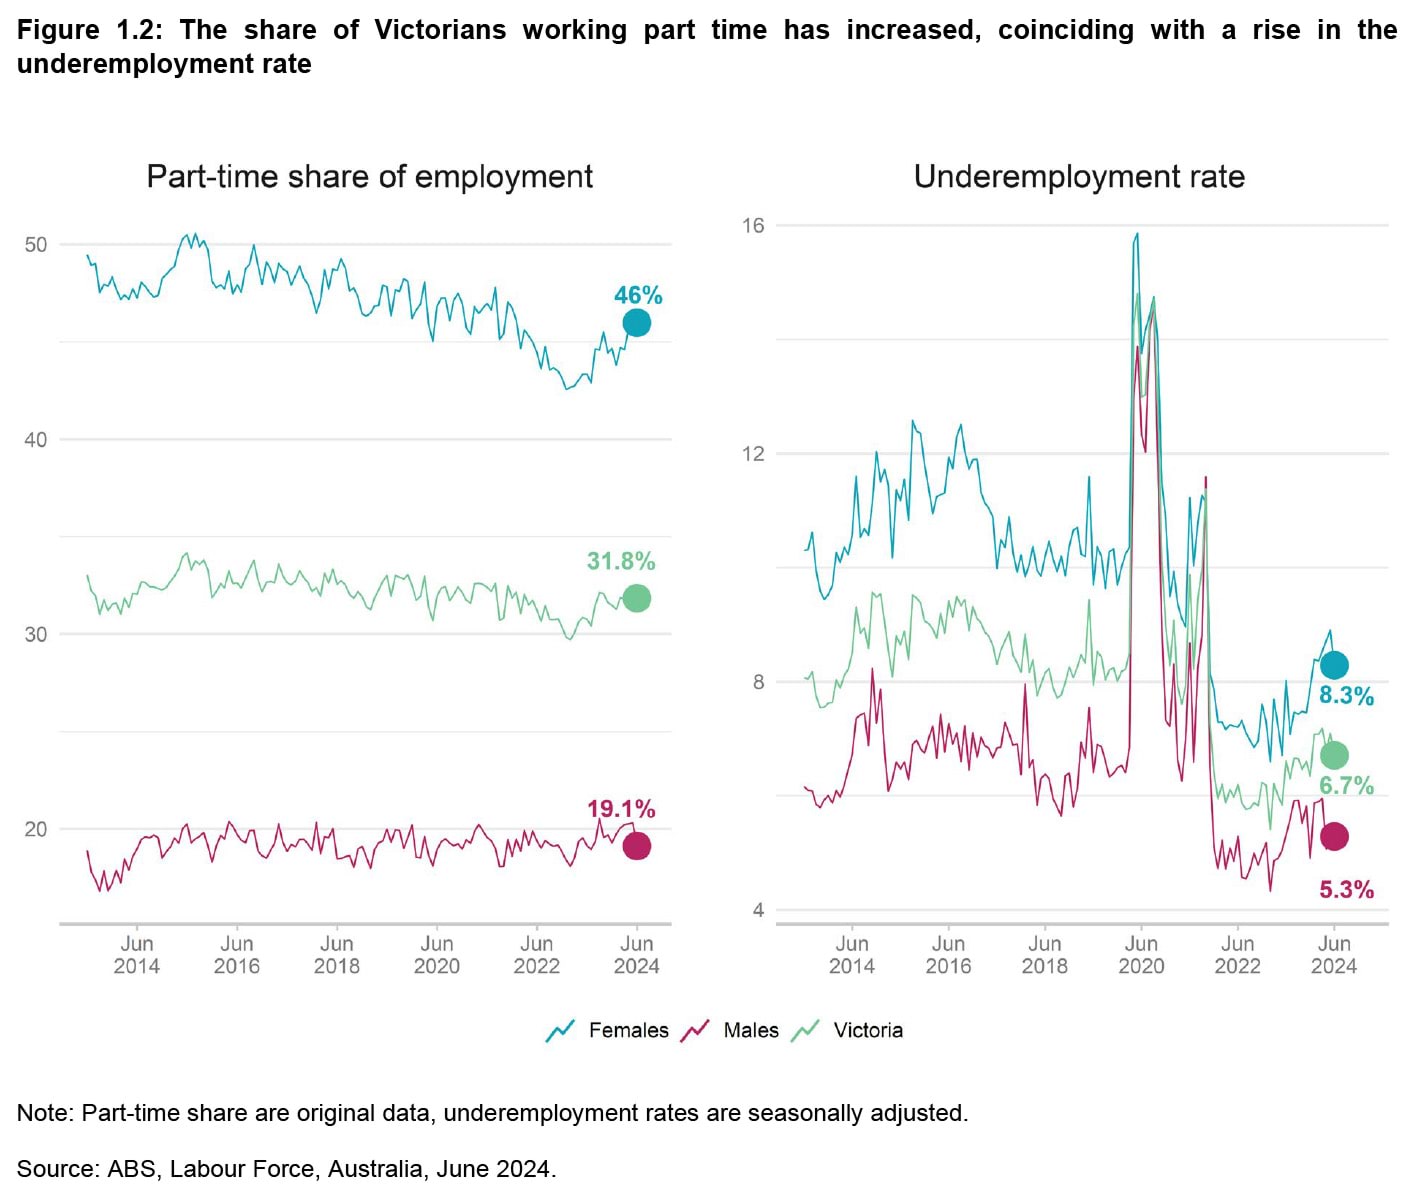
Since early 2023, most of the growth in employment has been in part-time jobs, resulting in a decline in average hours worked. In turn, there has been a pickup in the share of people who have jobs but would like to work more hours (measured by the underemployment rate), though this remains below historical averages. The female underemployment rate in Victoria (at 8.3 per cent) has increased since early 2023 but remains below the average over the prior decade, and remains higher than the male underemployment rate (5.3 per cent).
Figure 1.2
A few industries drive employment growth
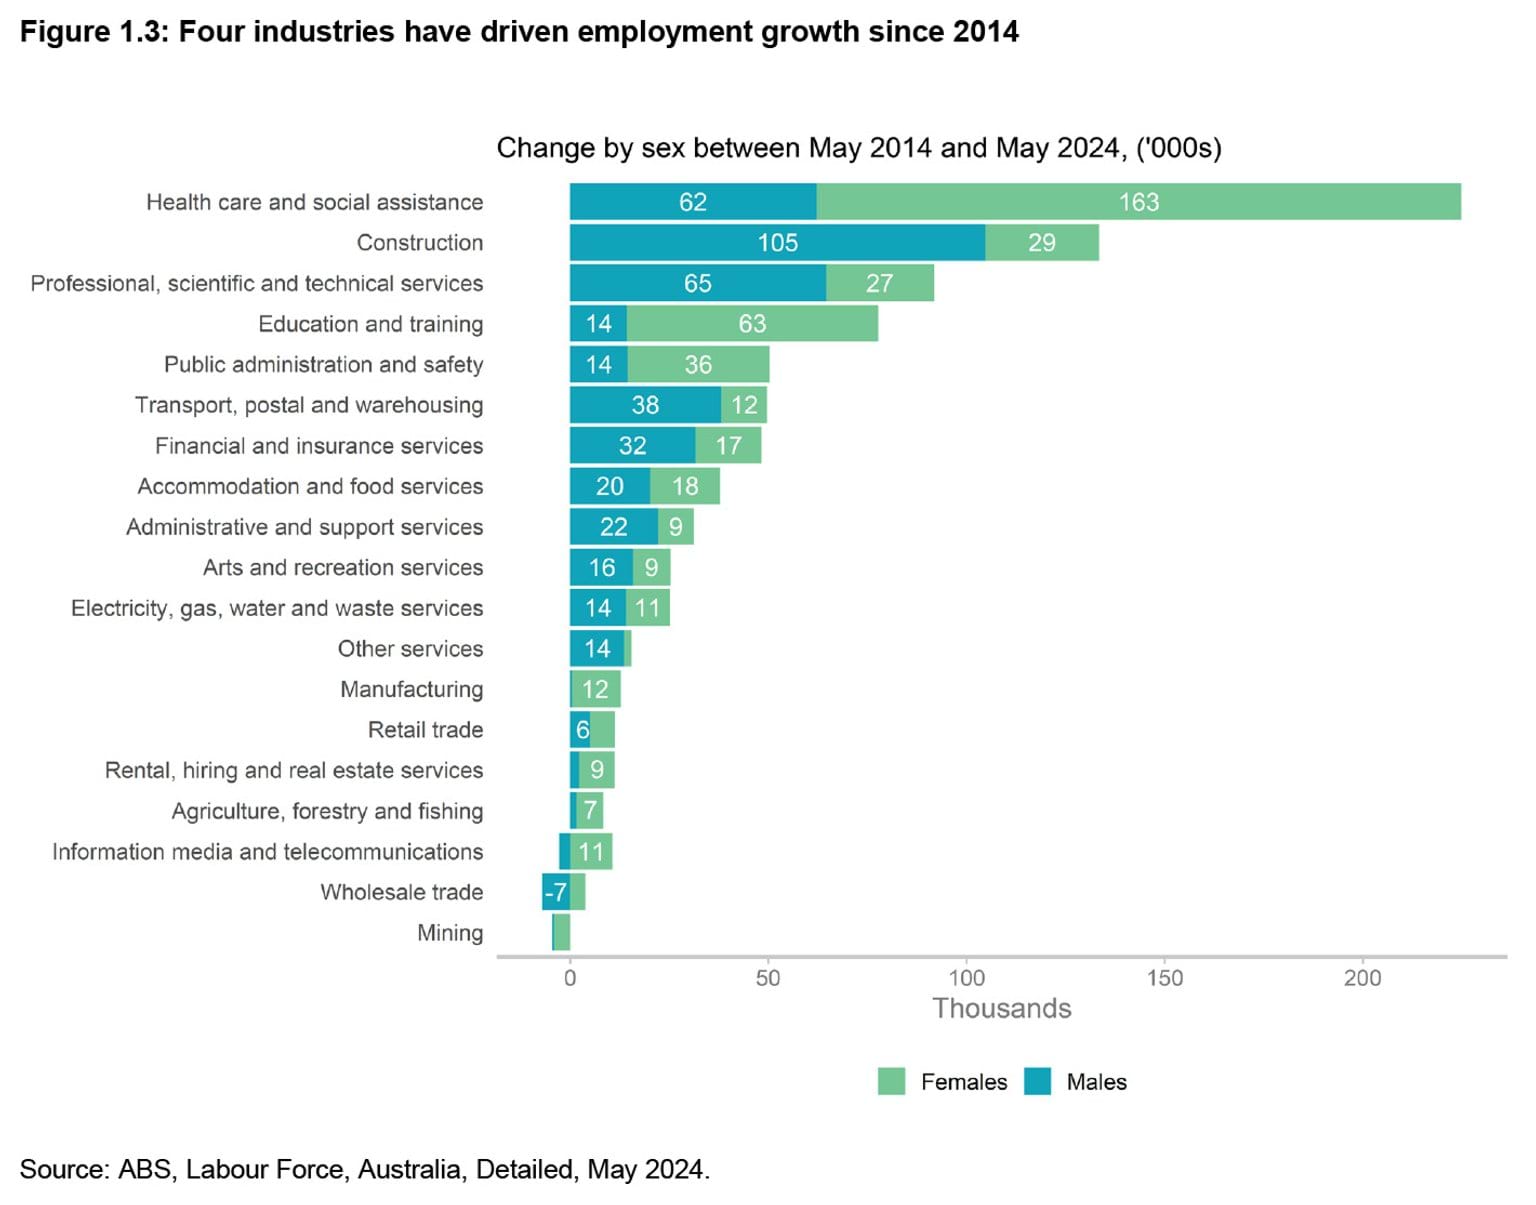
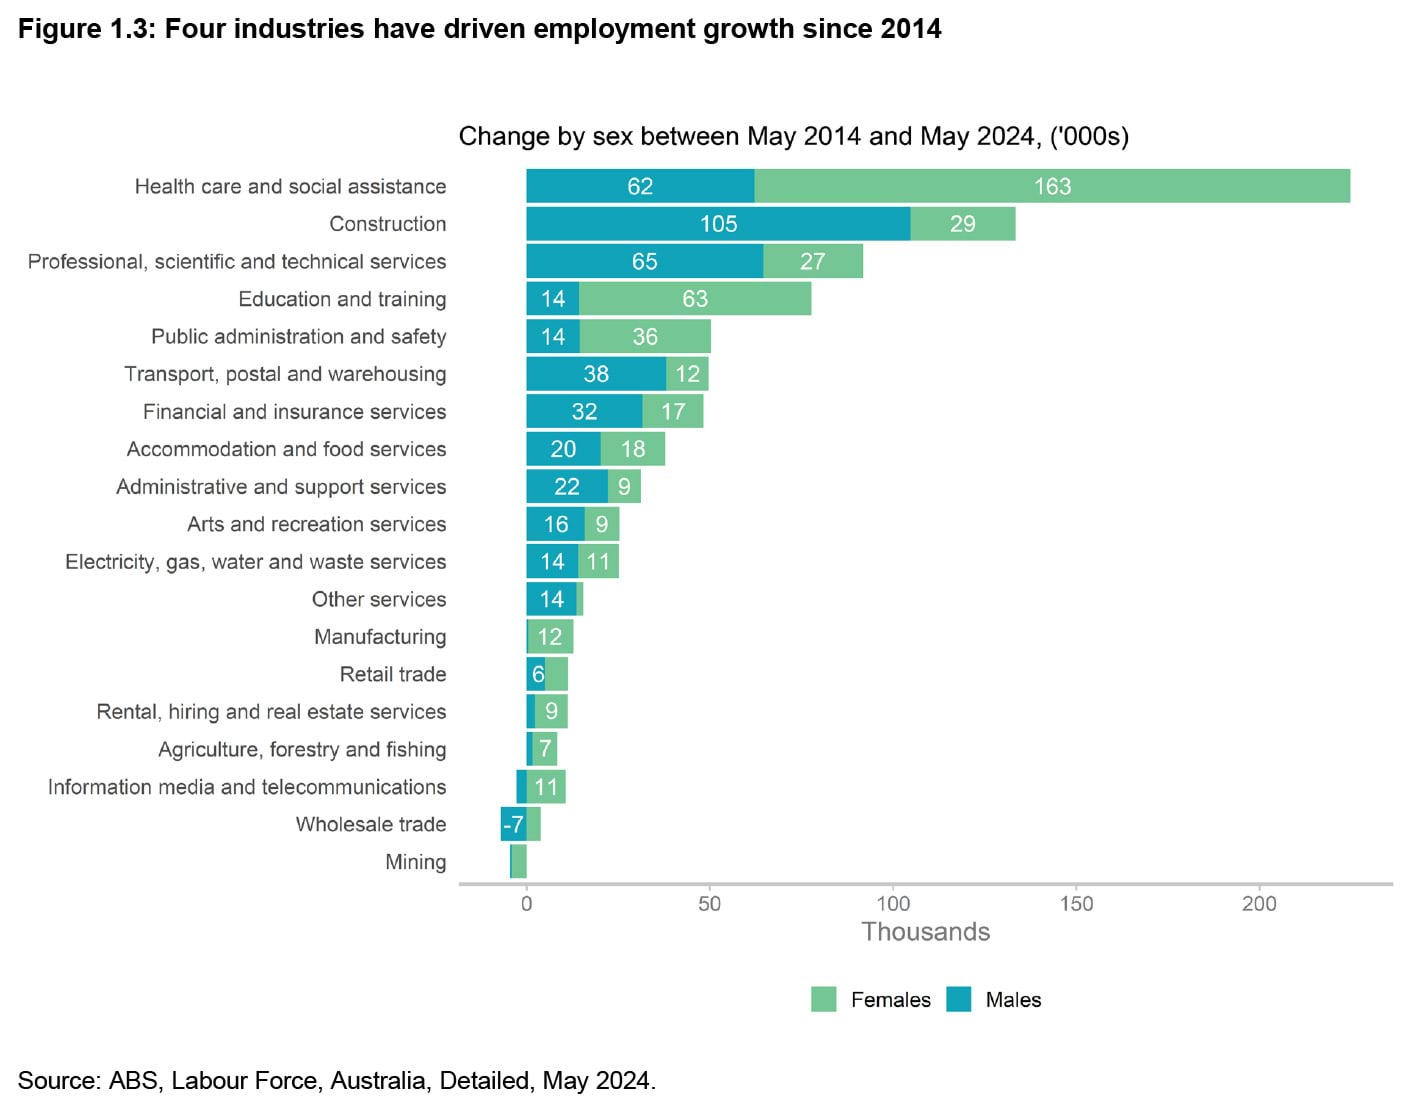
Four industries have driven employment growth in Victoria since 2014: health care and social assistance; construction; professional, scientific and technical services; and education and training. These four industries accounted for 62 per cent of employment growth over the last 10 years, and account for 43 per cent of total Victorian employment in May 2024. For nine of the 19 industries, growth in female employment accounted for more than half of employment growth over the same period.
Figure 1.3
The strong labour market is making it easier for more Victorians to get jobs
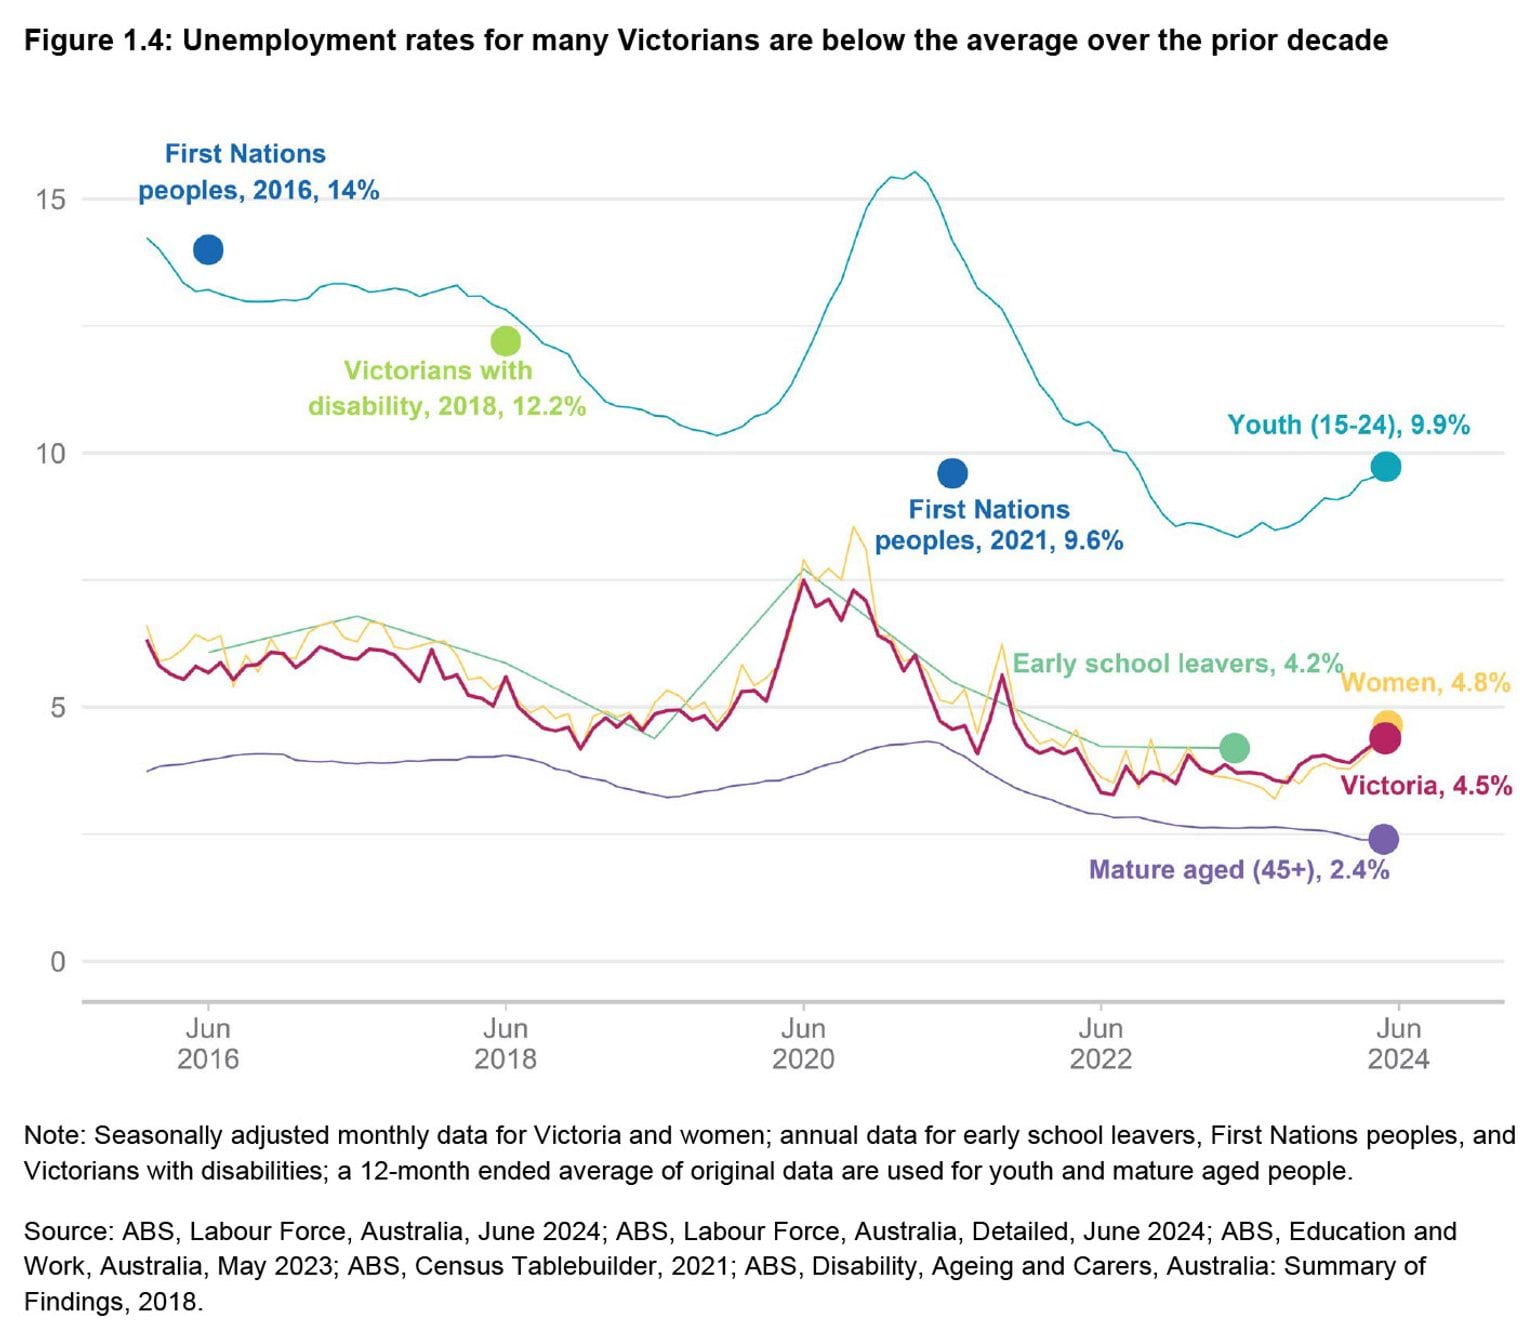
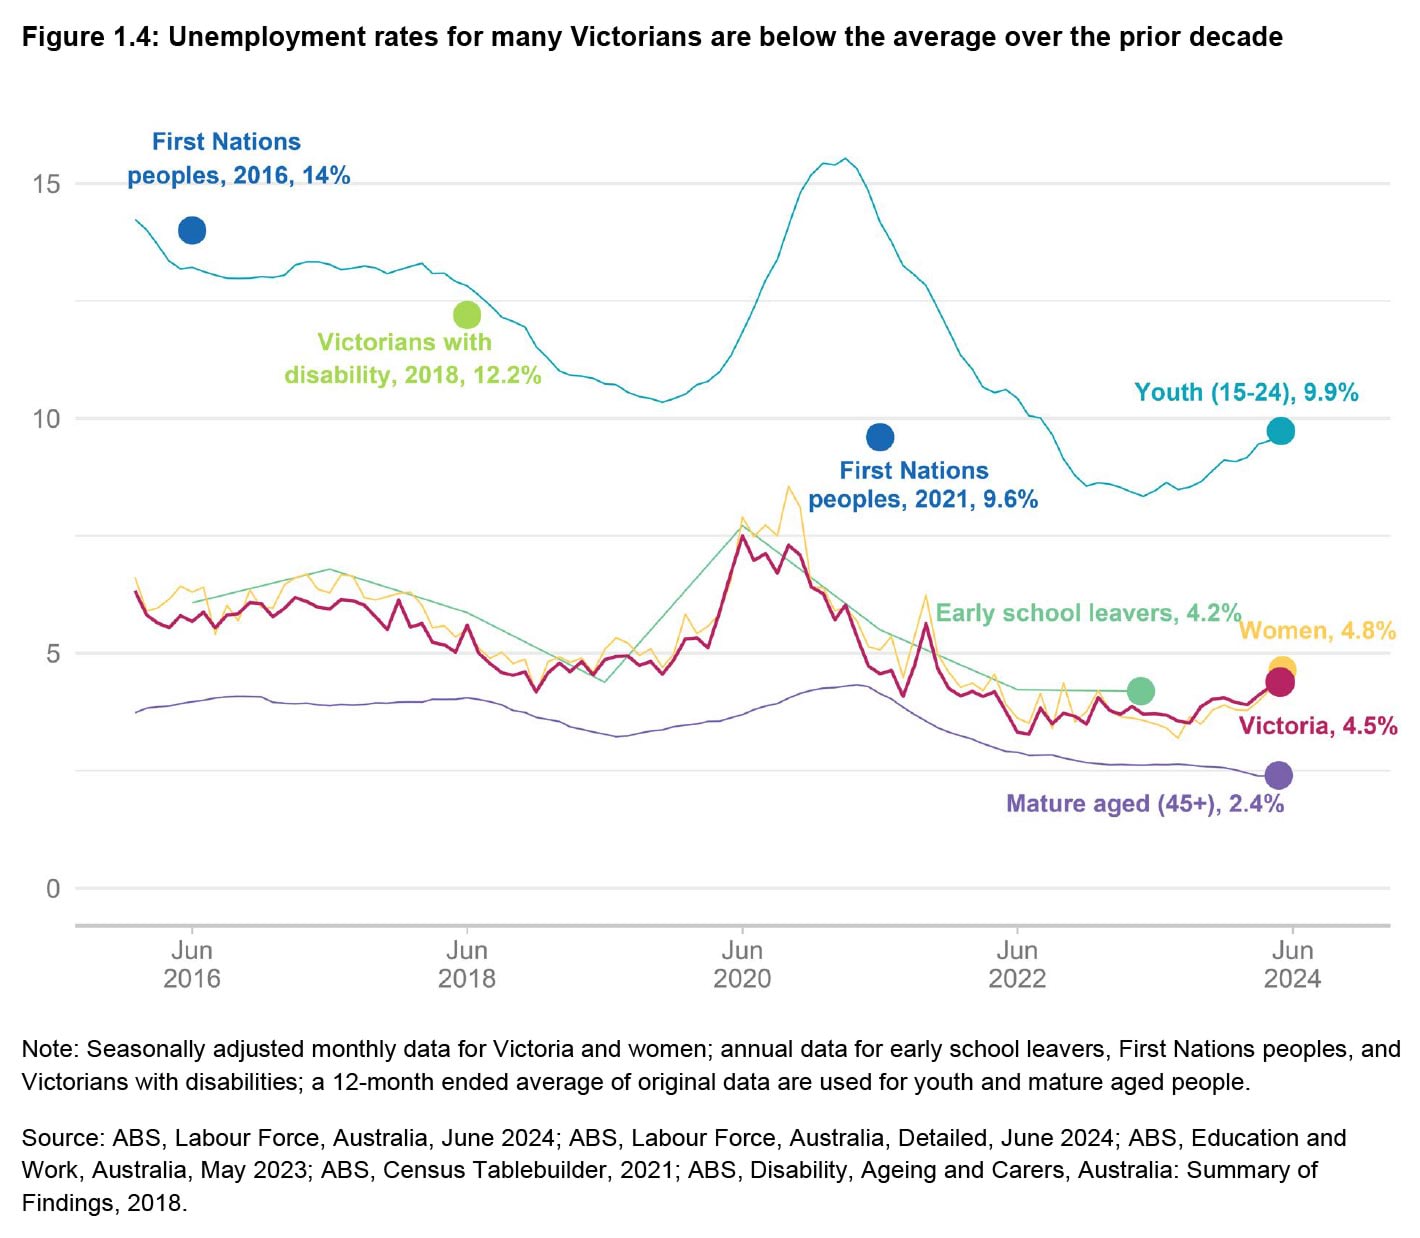
The strong labour market has made it easier for more Victorians to get jobs. As a result, unemployment rates for Victorians that have historically faced complex and structural barriers to employment, such as women, young people, mature-aged workers, and early school leavers are below the average for the prior decade. However, the unemployment rates for young people and women have risen since 2023. The rise in youth unemployment is consistent with previous periods when labour demand has eased.
Figure 1.4
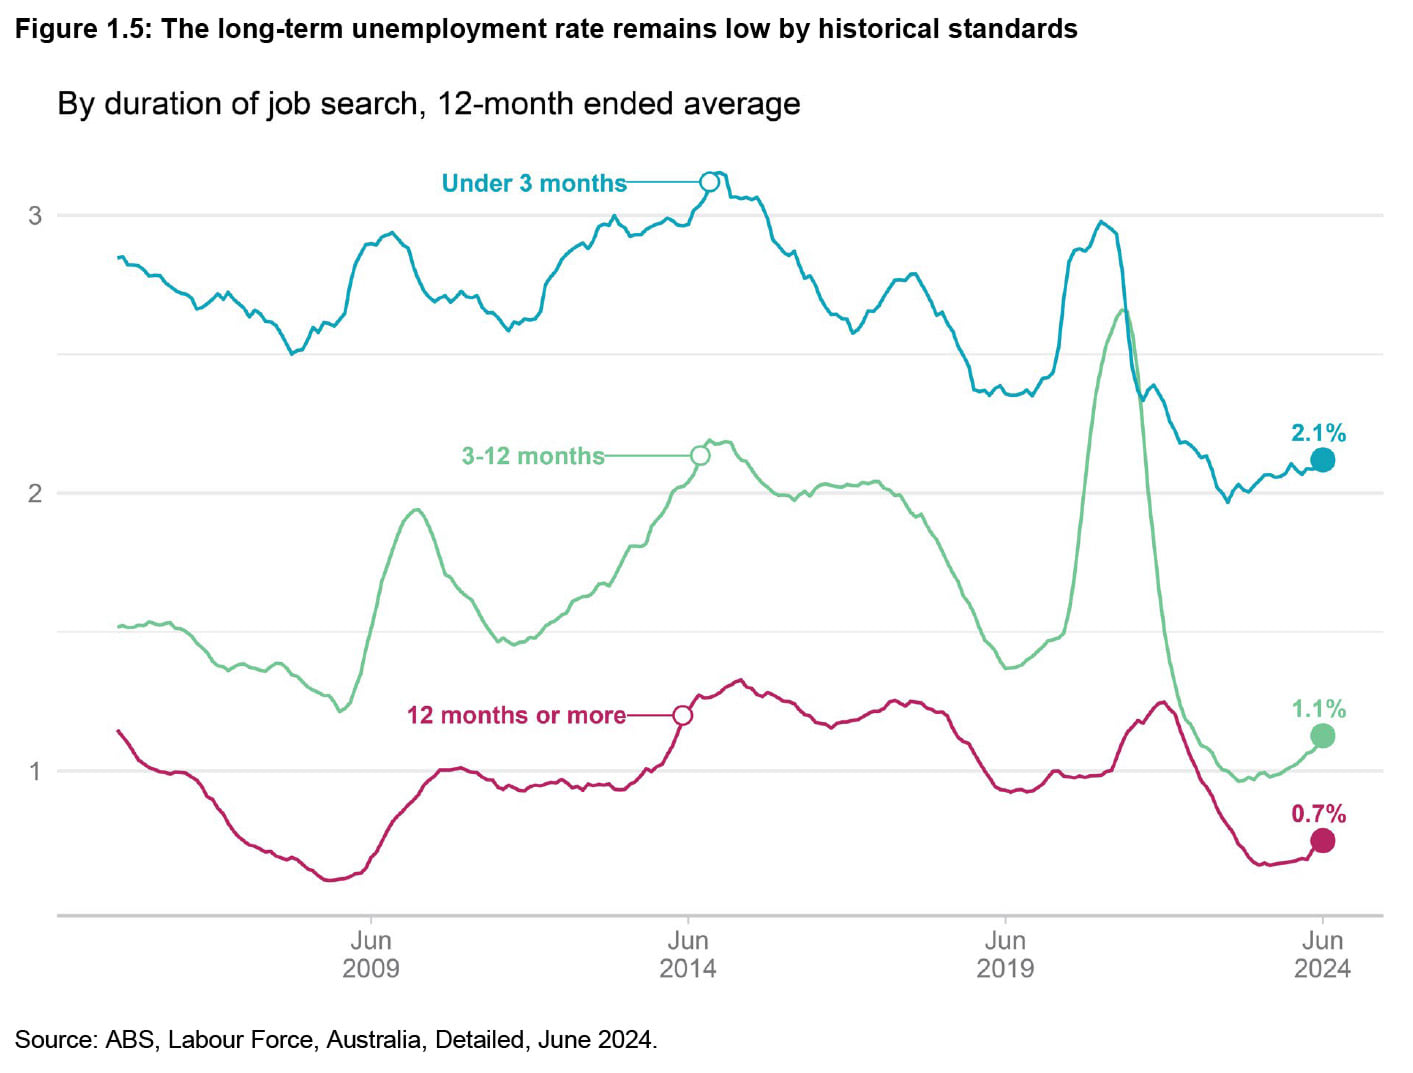
The long-term unemployment rate (people who have been searching for work for 12 months or more) has increased slightly but is still low by historical standards.
Figure 1.5

Unemployment in regional Victoria remains low compared to Greater Melbourne. 1 In part, the strength in regional labour markets reflects strong population growth and economic activity resulting in strong demand for labour. While unemployment in regional Victoria is low, the share of people in regional Victoria either working or actively looking for work (measured by the labour force participation rate) is lower than in Greater Melbourne.
2. The demand for workers in Victoria remains elevated
This section details job vacancy numbers and mobility rates, and discusses why workforce recruitment challenges are easing. It explores the prominence of workforce shortages in regional Victoria, and factors contributing to workforce shortages overall.
Job vacancies have declined but remain high
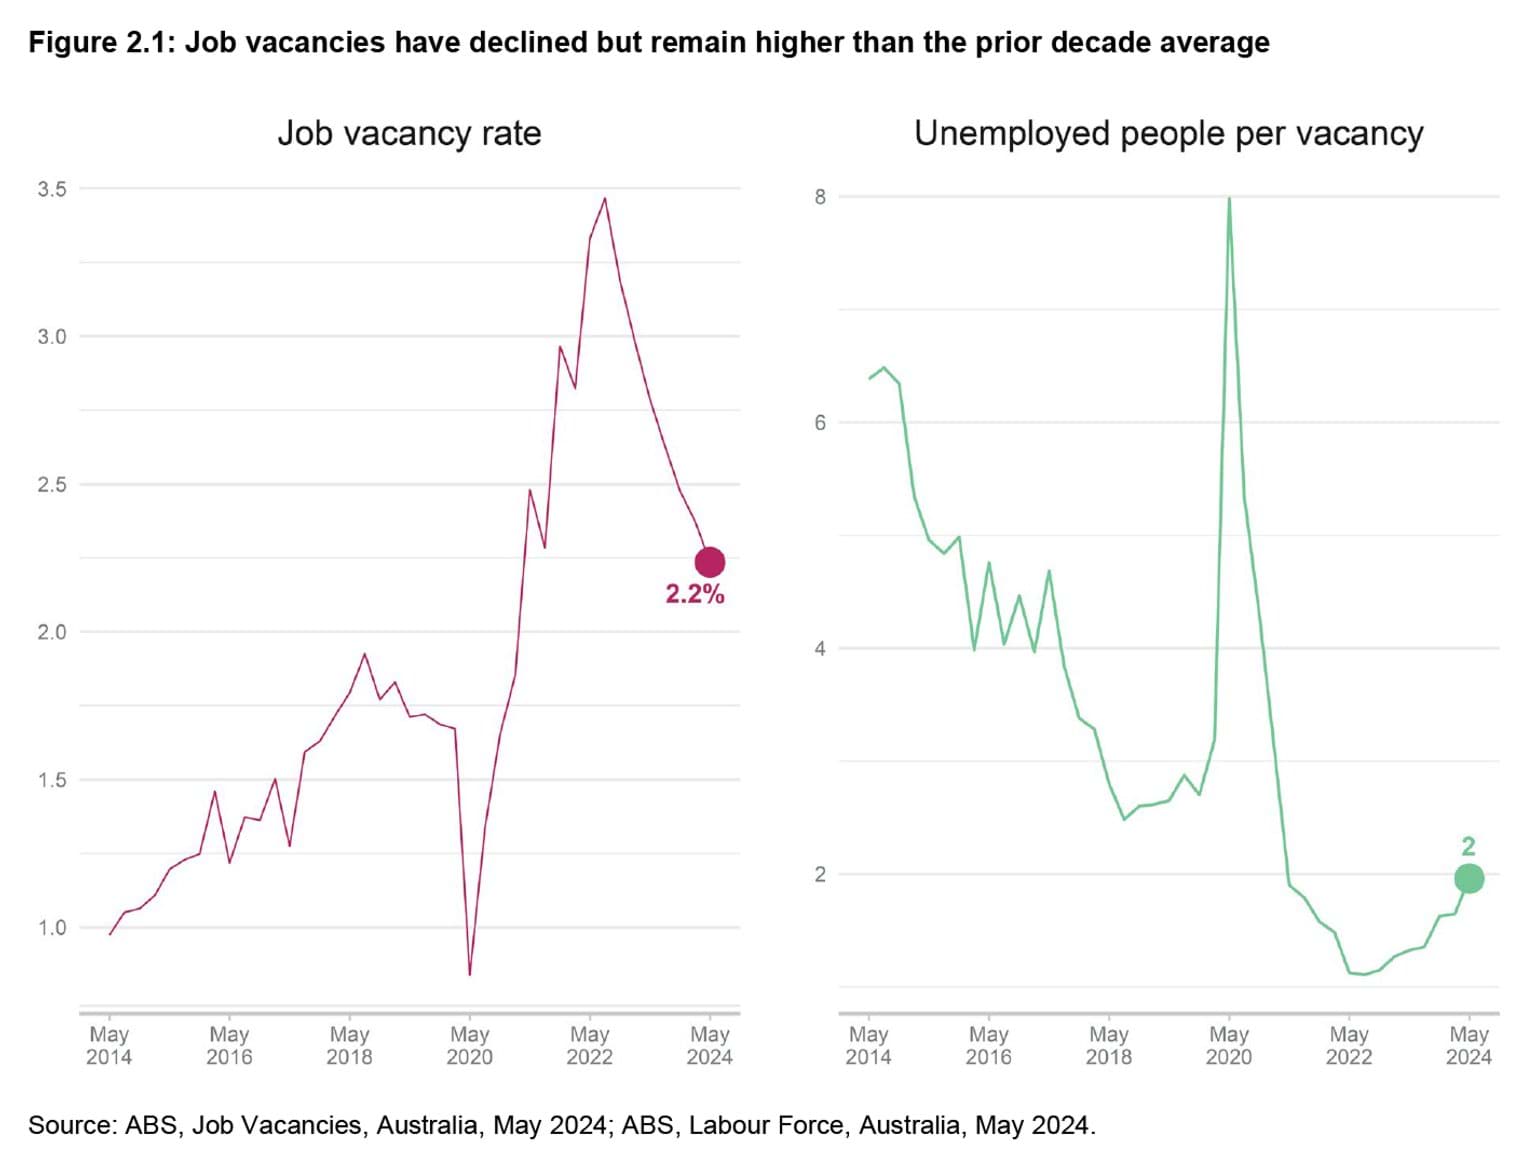
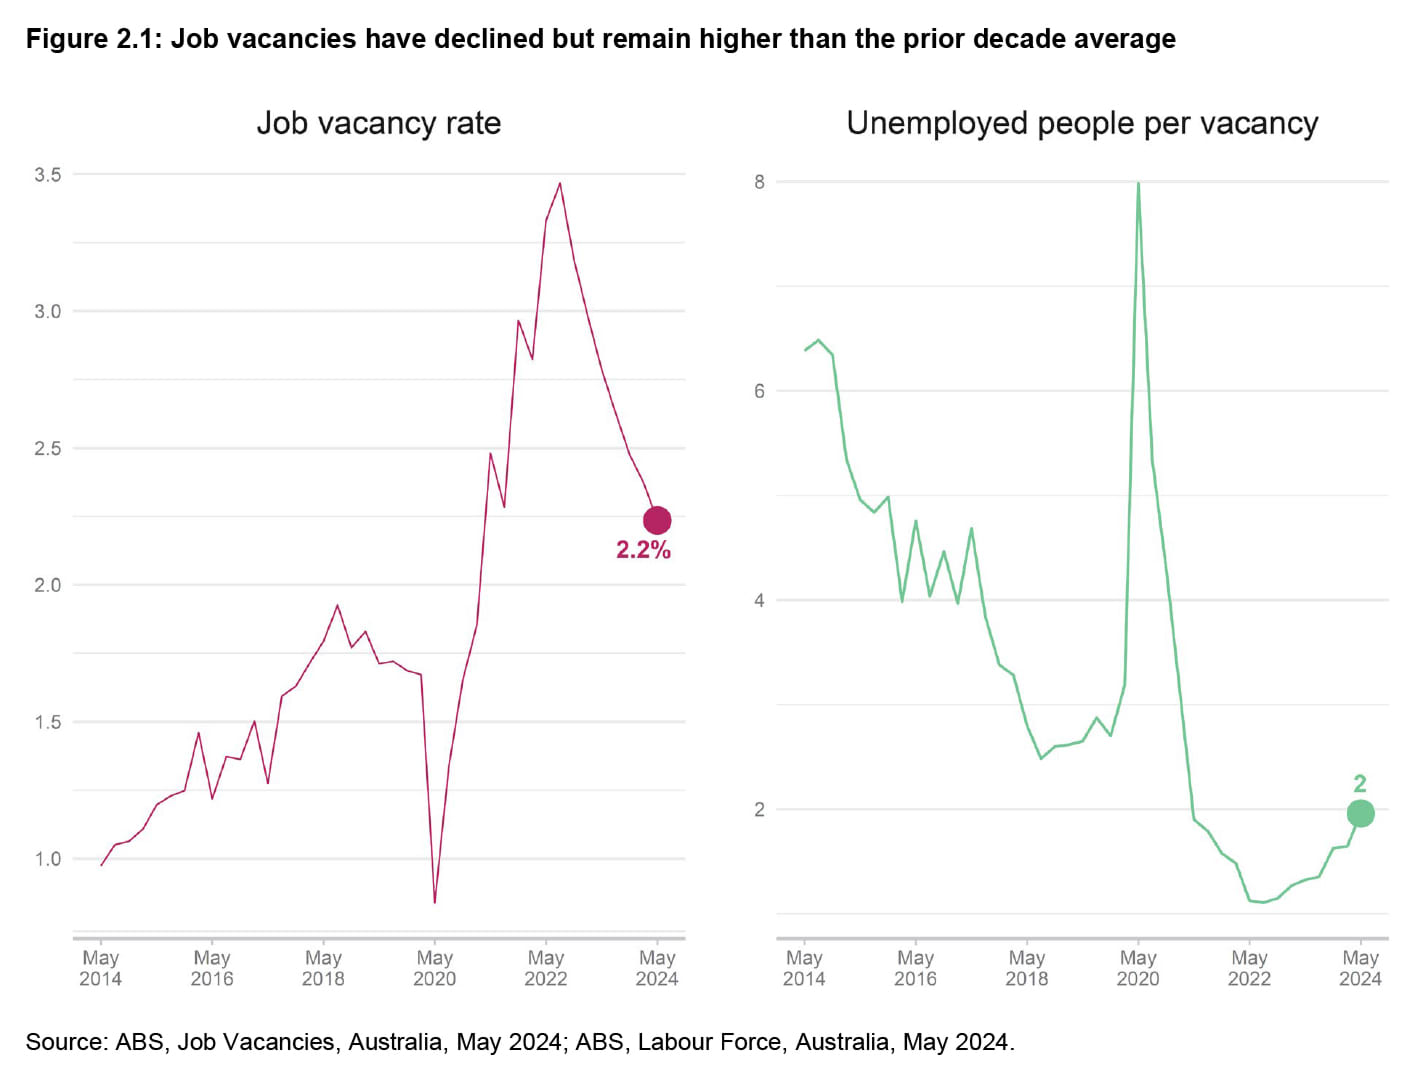
Job vacancies as a share of the Victorian labour force (as measured by the job vacancy rate) have declined from the highs reached in late 2022 but remain higher than the average over the prior decade.
The number of unemployed Victorians per vacant job has also picked up slightly but remains at near record lows. There are now two unemployed Victorians for each vacancy, higher than early 2022 but well below pre-2020 levels.
Figure 2.1
The job mobility rate in Victoria has declined
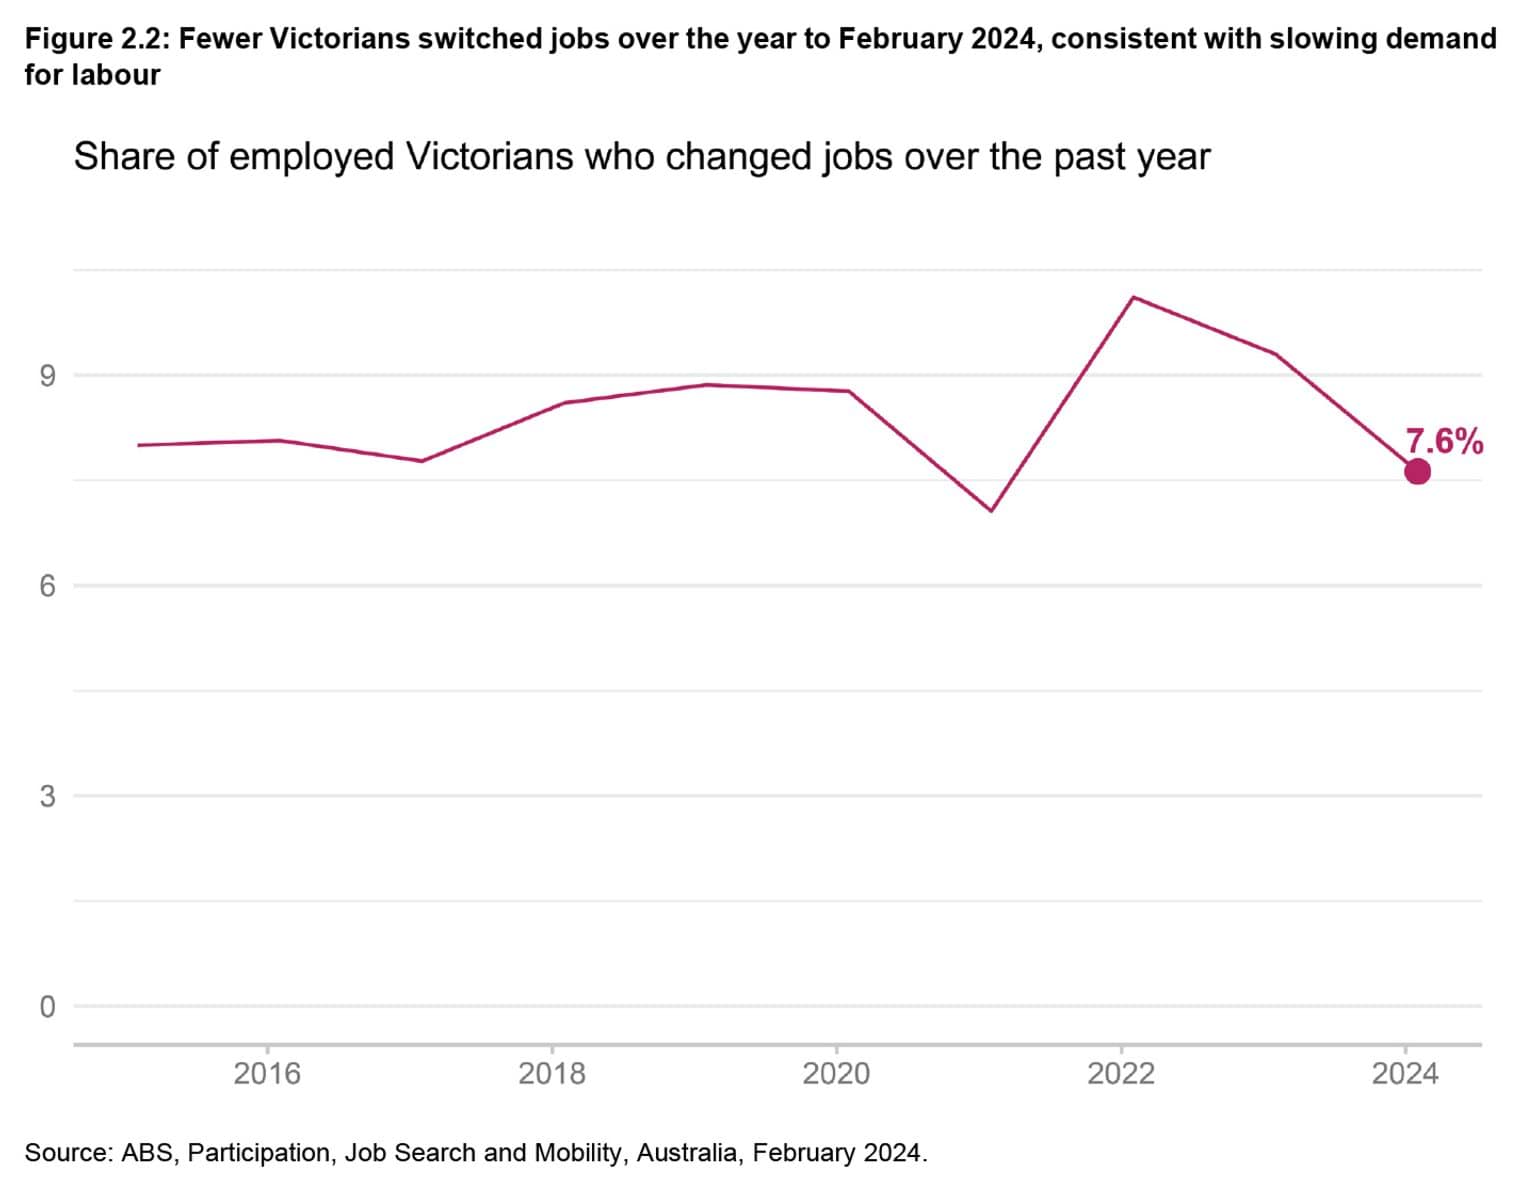
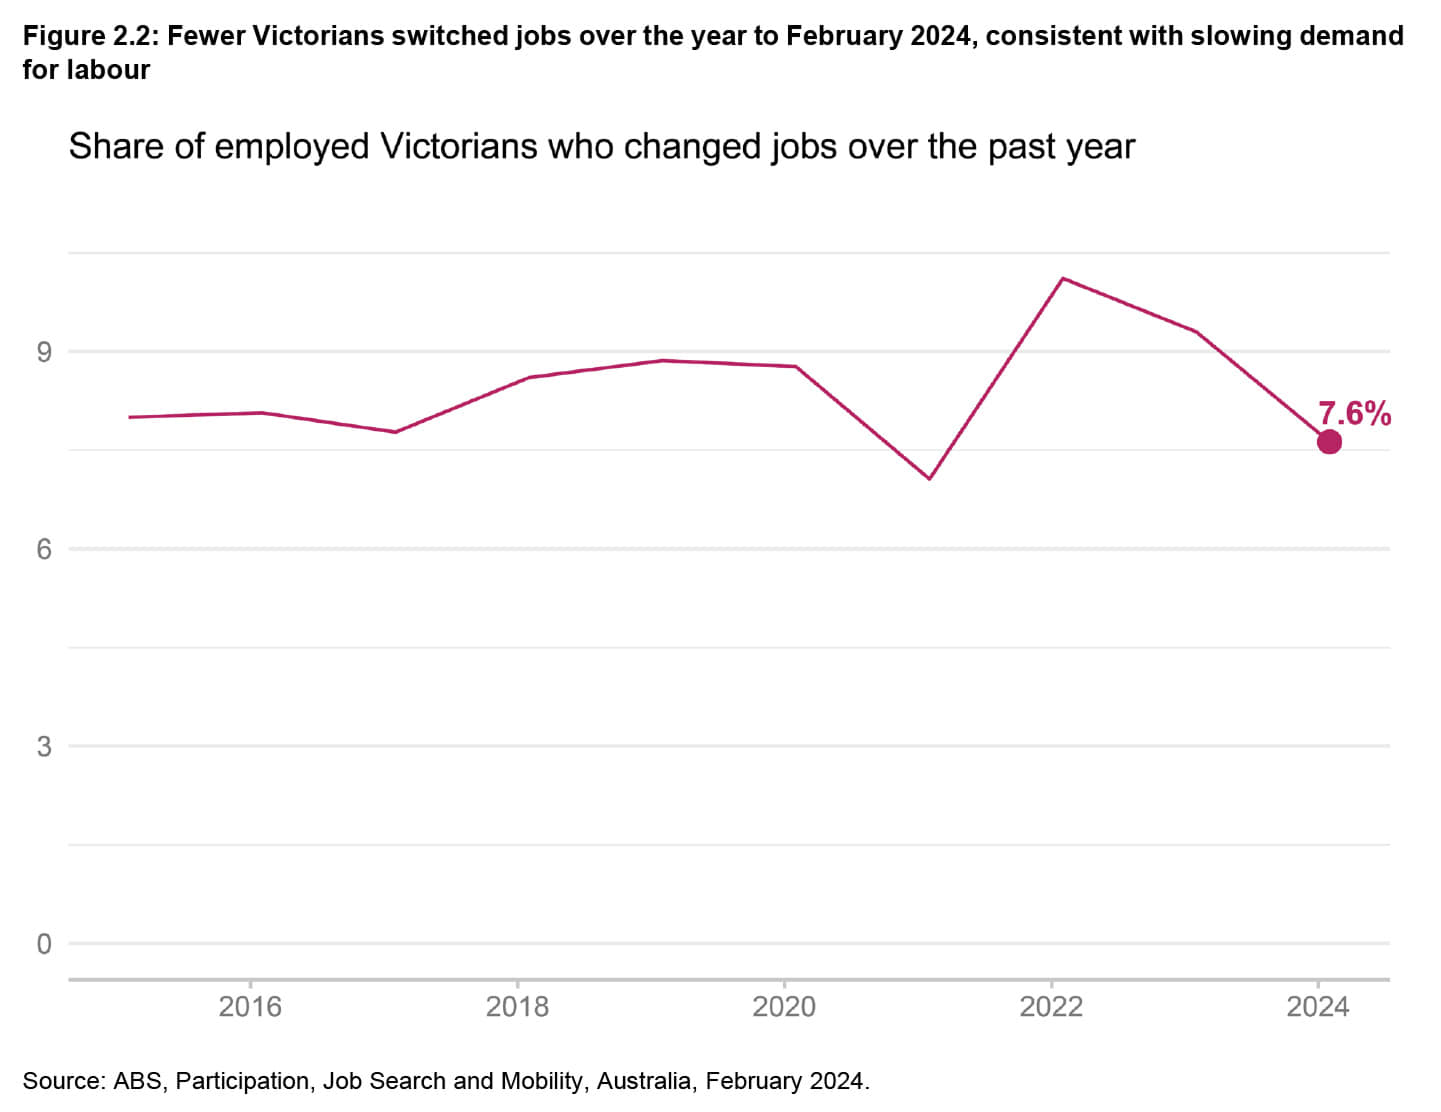
Around 280,000 Victorians changed jobs over the year to February 2024, representing 7.6 per cent of employed people. This has declined from a high of 10.1 per cent in 2022, consistent with slowing demand for labour. Of the Victorians who changed jobs over the year to February 2024, around half changed industry and around 40 per cent changed occupation.
Figure 2.2
Some indicators suggest it is becoming less difficult to hire workers
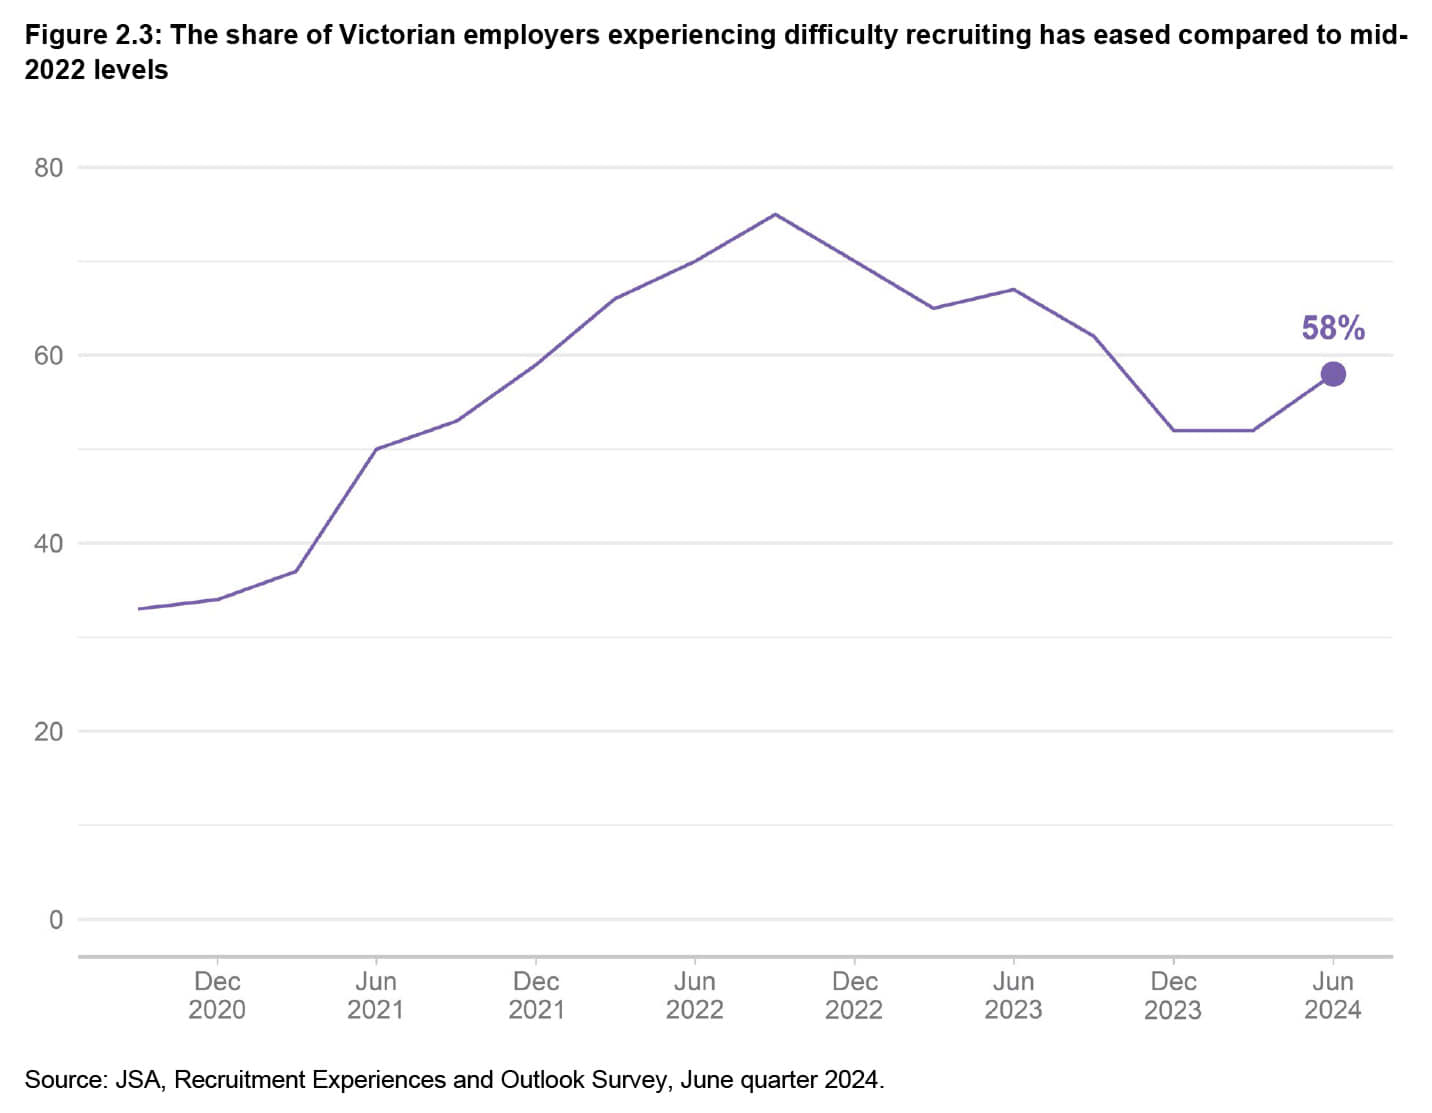
While almost six in 10 employers are still finding it difficult to recruit workers, recruitment difficulty has eased compared to mid-2022 levels. This improvement has largely been driven by employers finding it easier to recruit lower skilled workers. Around 40 per cent of employers across Australia find it difficult to hire lower-skilled workers, compared to around 70 per cent of employers who find it hard to recruit higher-skilled workers.
Figure 2.3

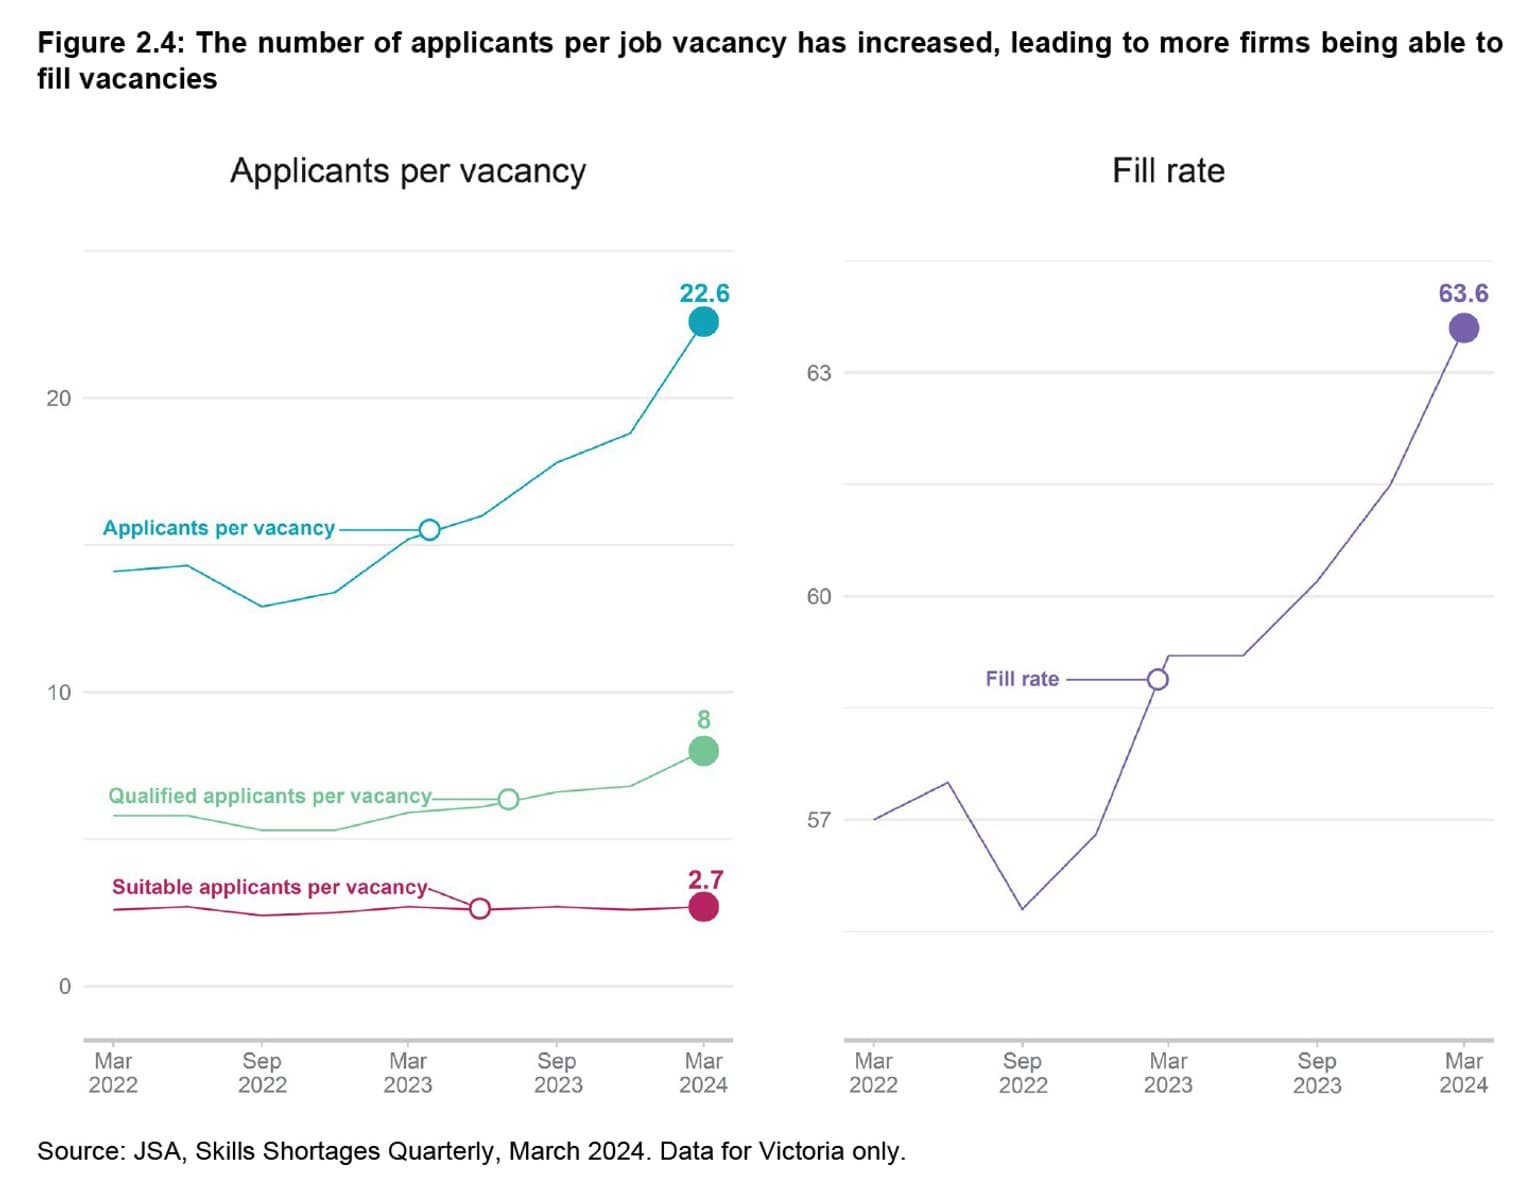
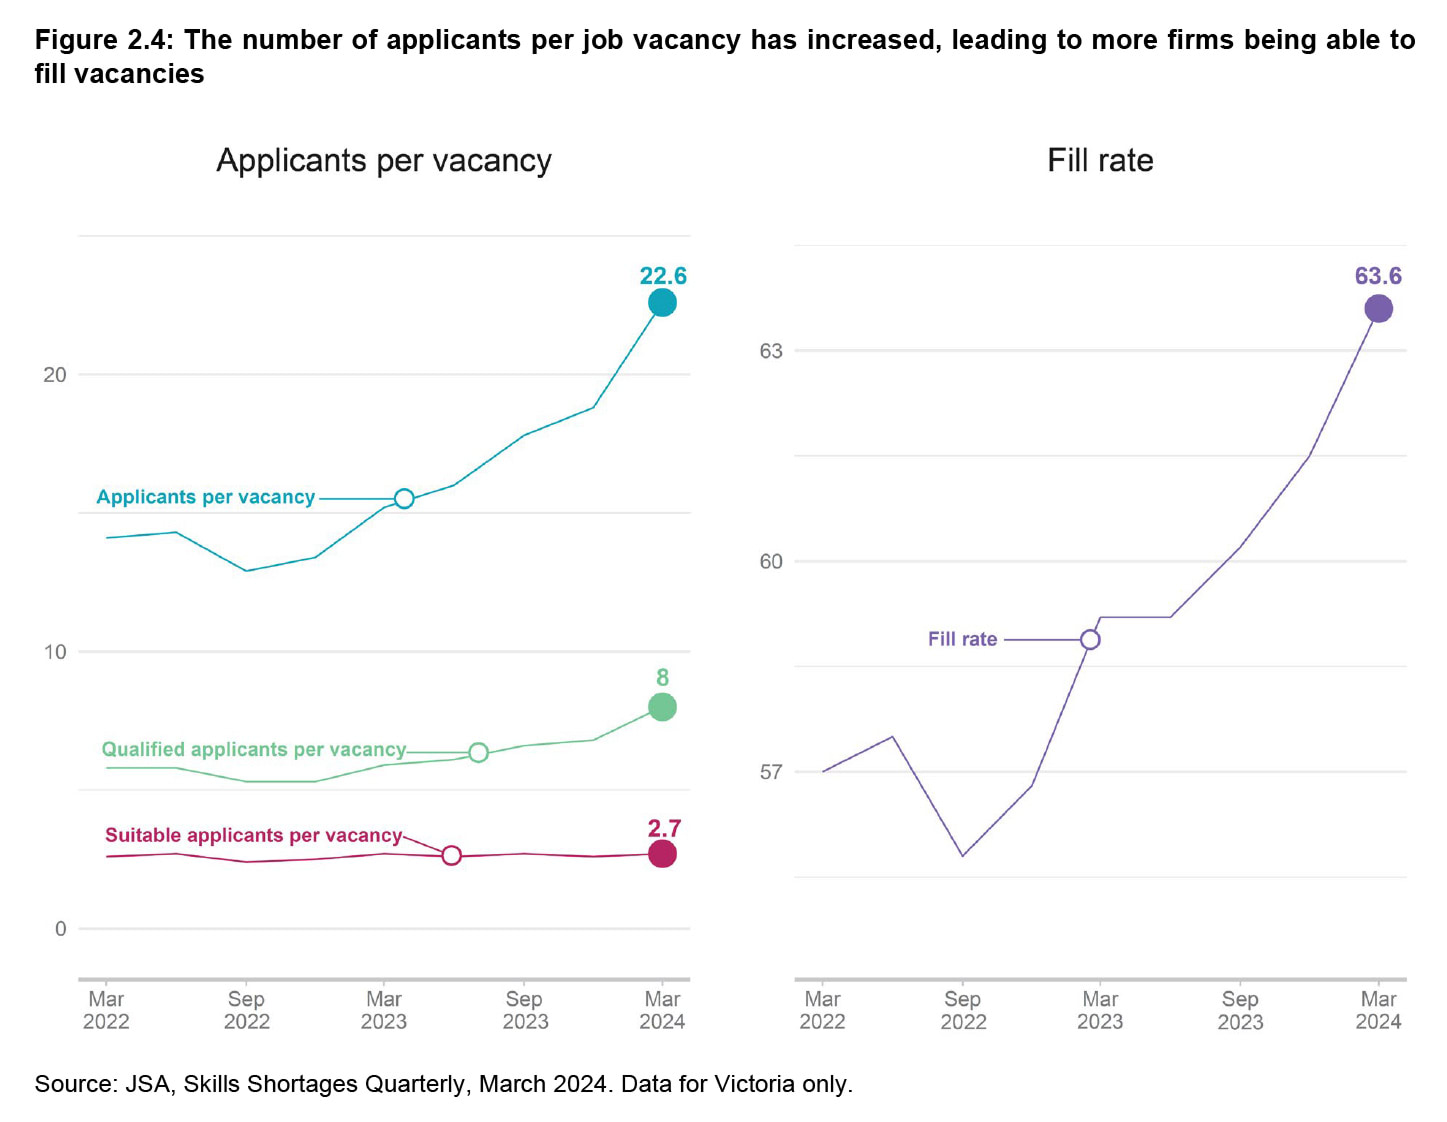
The share of vacancies filled in a quarter (the fill rate) in Victoria has risen from the trough in late 2022, showing that more employers are able to fill more vacancies than in prior quarters. There are now also more applicants per vacancy and more qualified applicants (deemed by employers as having the right qualification for the job) per vacancy on average. The average number of suitable applicants (deemed by employers as suitable for the job) per vacancy has remained steady at a low level.
Figure 2.4
Since late 2022, fill rates have improved across all occupation groups. However, technicians and trade workers, along with labourers continue to have lower fill rates relative to other occupation groups. Across Australia, fill rates over the same period have improved across both regional and metro areas, but remain more challenging in regional areas.
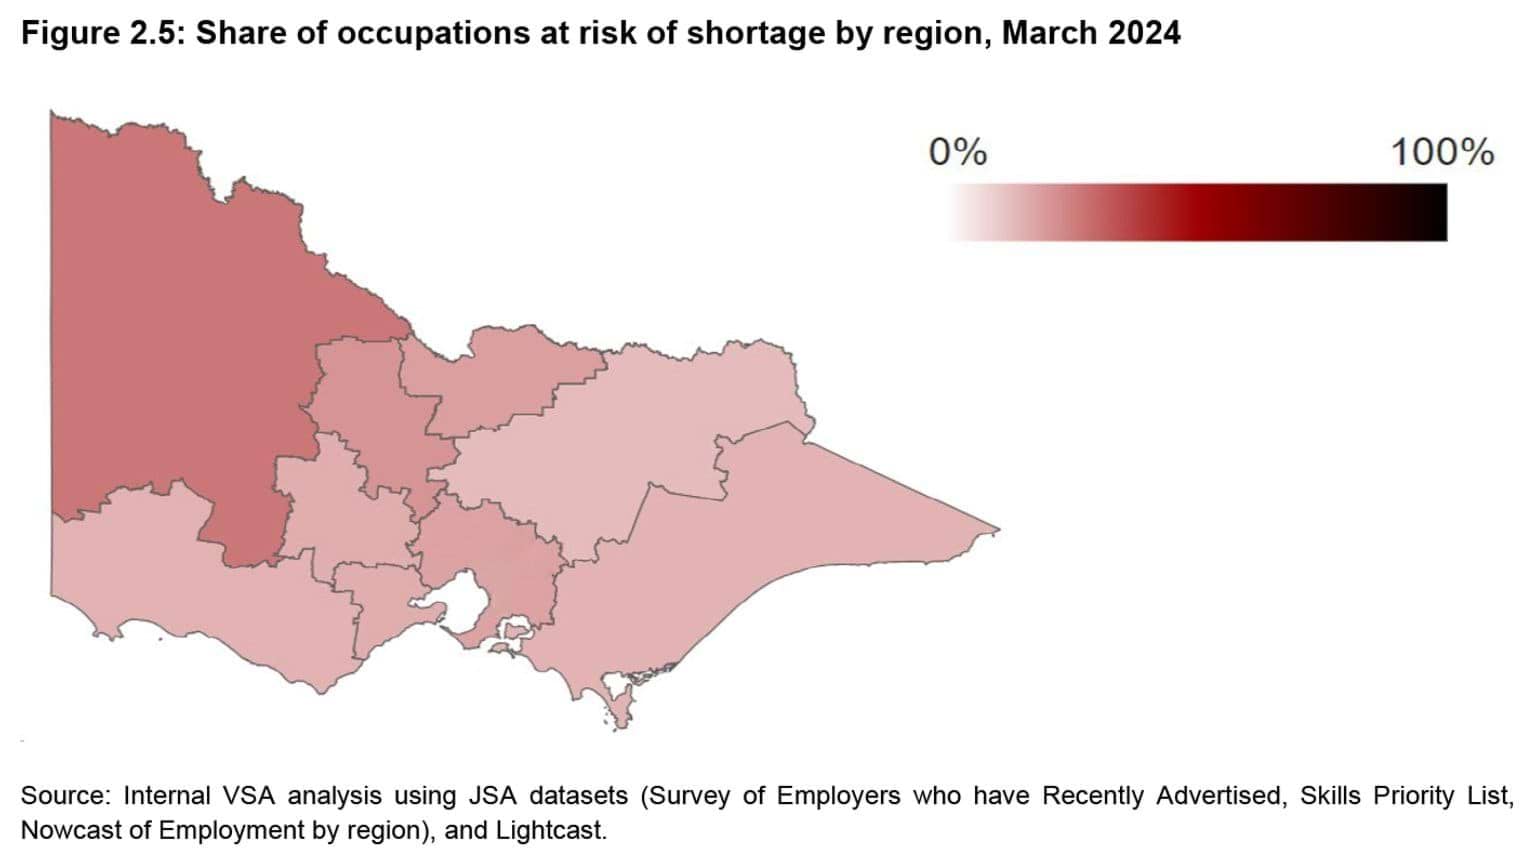
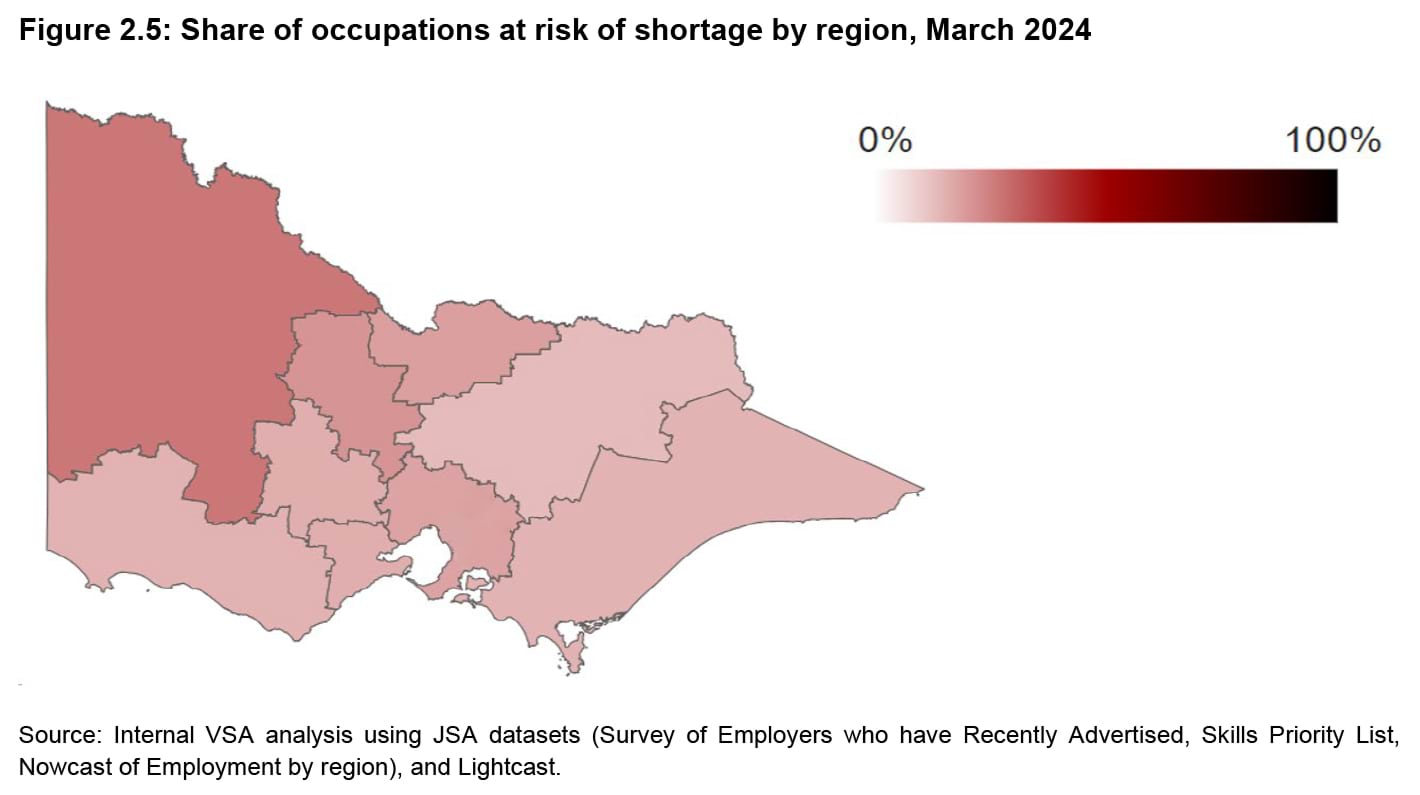
Workforce shortages are more pronounced in regional Victoria
As at March 2024, 62 out of 350 (17.7 per cent) assessed occupations2 in Victoria were at risk of shortage, a decrease from 35.7 per cent in March 2023.3
The proportion of occupations at risk of shortage was lower in metropolitan Melbourne compared to regional Victoria.4
Figure 2.5
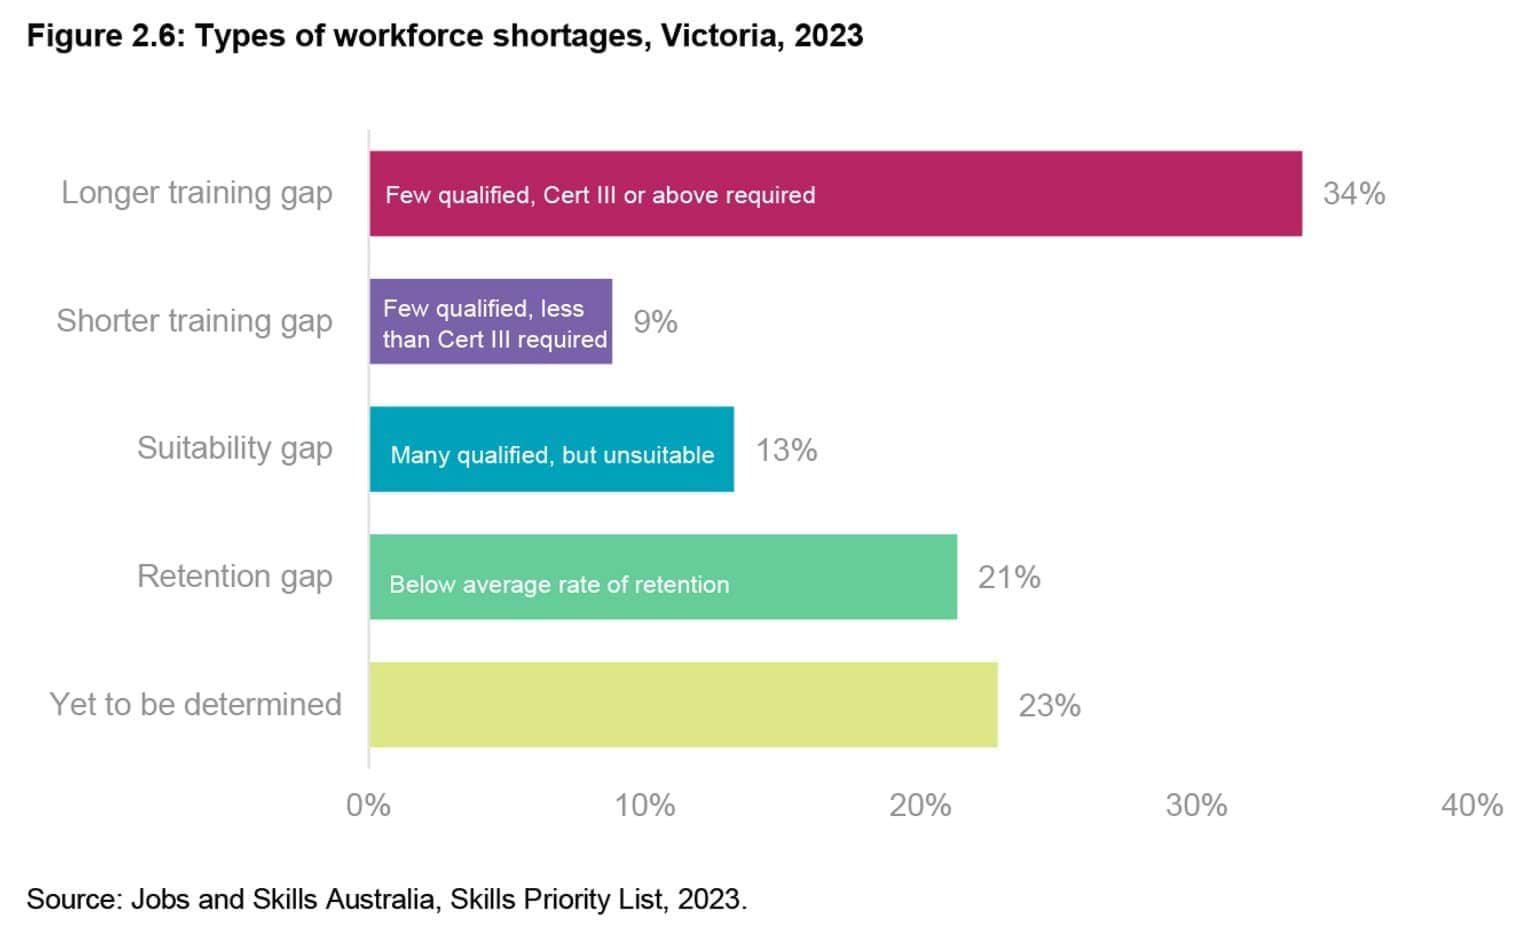
There are many drivers of workforce shortages
Jobs and Skills Australia has developed a workforce shortage typology that classifies workforce shortages into four types, based on the primary driver of shortage.5
- Longer training gap – few qualified applicants per vacancy and a long training pathway (Certificate III or above).
- Shorter training gap – few applicants per vacancy and qualifications less than Certificate III are required.
- Suitability gap – enough qualified applicants, but they are not regarded as suitable, due to factors such as a lack of employability skills, work experience and/or bias of employers.
- Retention gap – below average rates of retention, potentially reinforced by low numbers of applicants per vacancy.
In Victoria, the most common workforce shortage driver is a longer training gap, followed by a retention gap.
Figure 2.6
The top 10 occupations with the highest number of internet vacancies are also mostly in shortage. Many of these shortages are driven by a retention gap, but the other drivers of shortages (that is, long training gap, short training gap, and suitability gap) also play a role.
Table 2.2: Occupations with the highest number of internet vacancies in Victoria, June 2024
| Internet vacancies | Workforce shortage driver | |
|---|---|---|
| General clerks | 2,747 | No shortage |
| Sales assistants (general) | 2,367 | N/A |
| Registered nurses | 2,128 | Long training gap |
| Advertising and sales managers | 1,490 | Suitability gap |
| Retail managers | 1,077 | Short training gap |
| Waiters | 1,053 | Retention gap |
| Ageing and disability carers | 1,037 | Retention gap |
| Software and applications programmers | 1,020 | Suitability gap |
| Child carers/early childhood educators | 1,008 | Retention gap |
| Accountants | 995 | No shortage |
Source: Jobs and Skills Australia, Internet Vacancy Index, Internet Vacancies, ANZSCO4 Occupations, States and Territories – June 2024; Jobs and Skills Australia, Skills Priority List, 2023.
3. Employability skills are in high demand
As technology, preferences and social and economic conditions change over time, so do the skills required to do a particular job. Changes in technology require workers to learn new skills to work productively with new tools. For example, with the rise in remote work, mentions of video and web-conferencing skills in job advertisements have more than doubled since 2019.
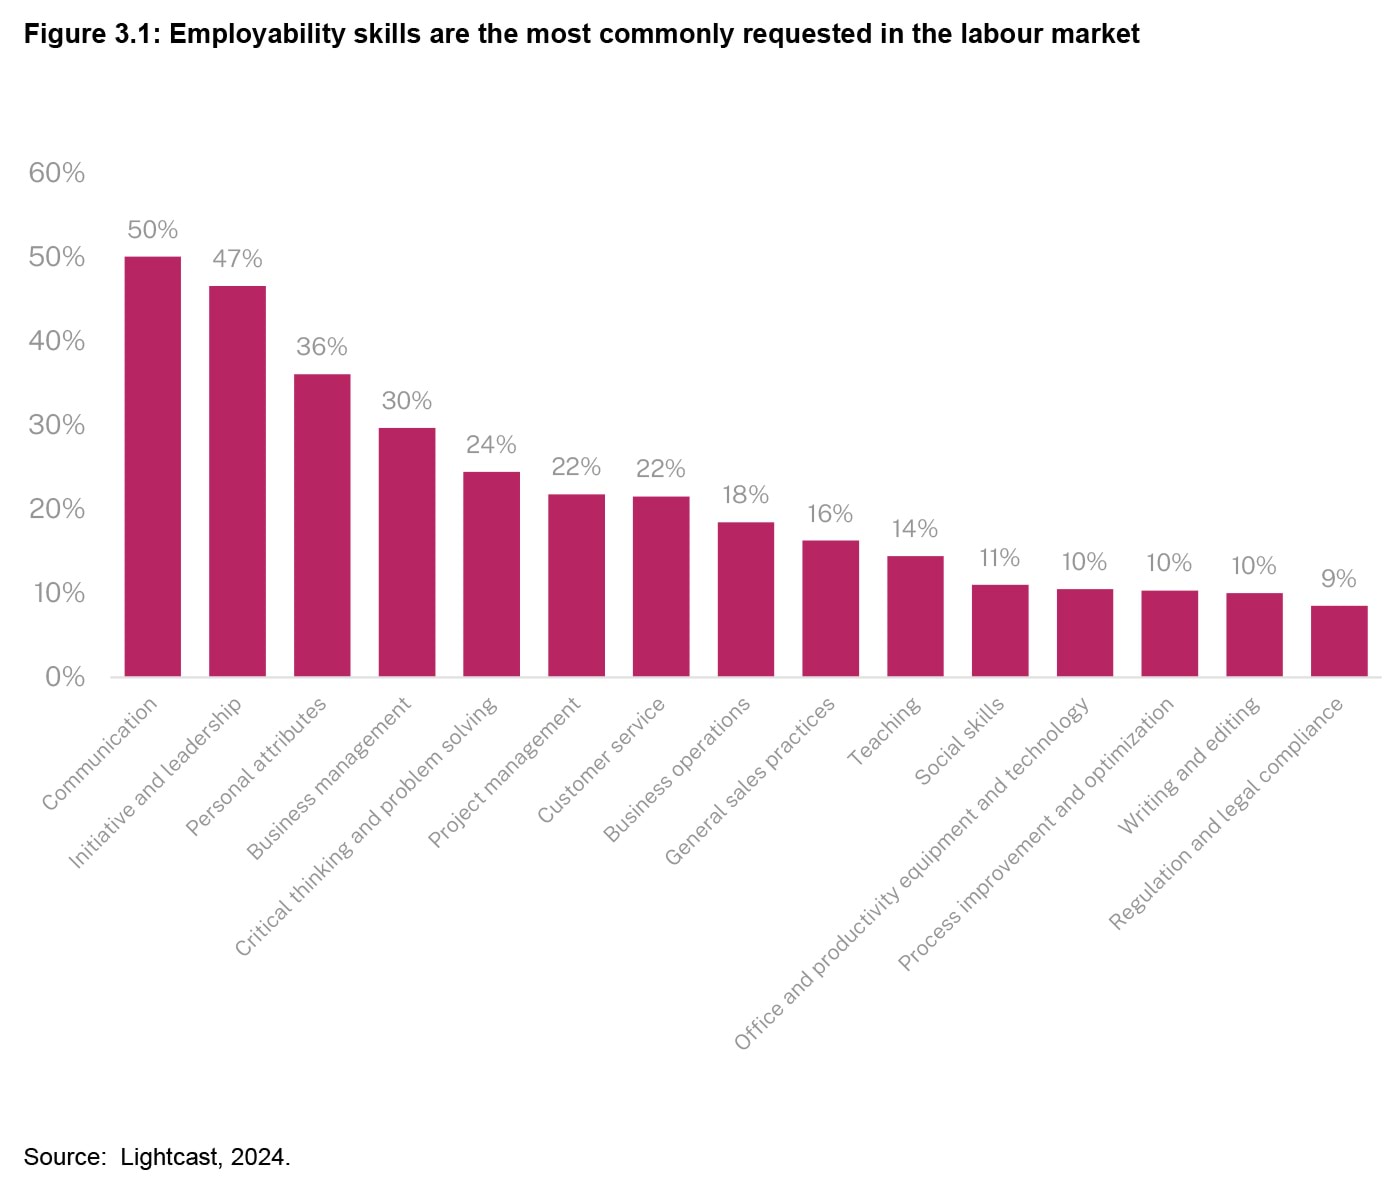
The top skills requested across online job advertisements are communication; initiative and leadership; and personal attributes (which include attitudes and behaviours such as attention to detail, organisational skills, multi-tasking, enthusiasm and willingness to learn). This highlights the importance employers place on interpersonal and intrapersonal skills, and their prevalence across the labour market.
Figure 3.1

Other common skills include widely applicable business skills such as business management, project management, customer service and general sales practices. These skills are widely used across different industries and occupations. Teaching is also a widely requested skill – mentioned in 14 per cent of job advertisements – and is prevalent both within the education industry and other occupations where employers look for workers who can teach and mentor junior staff.
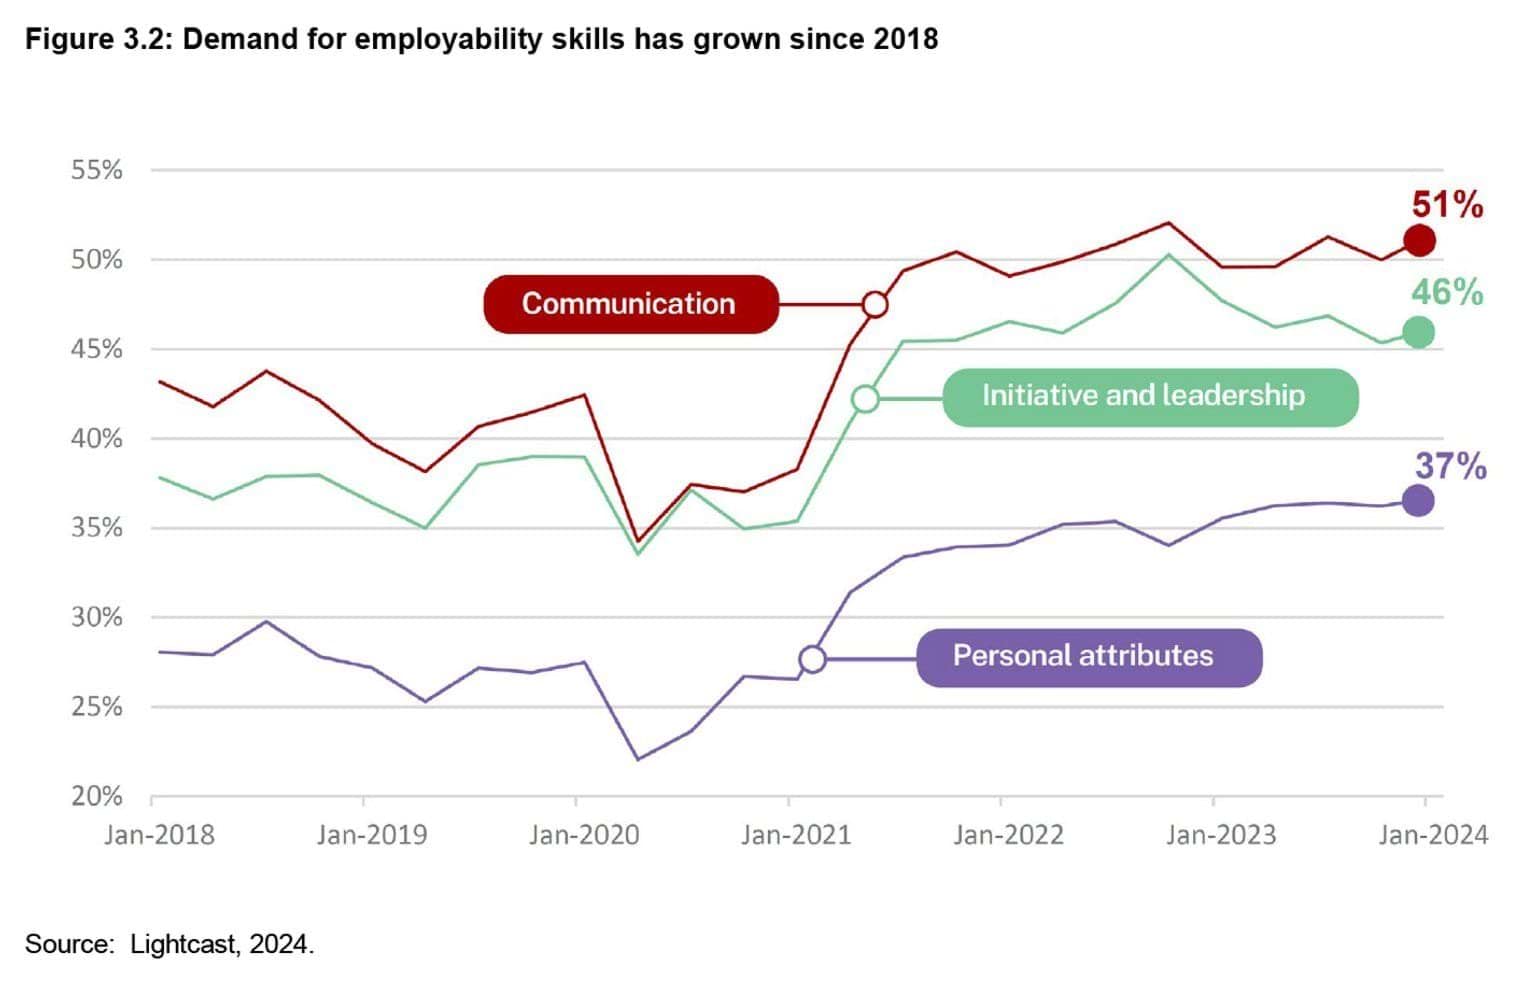
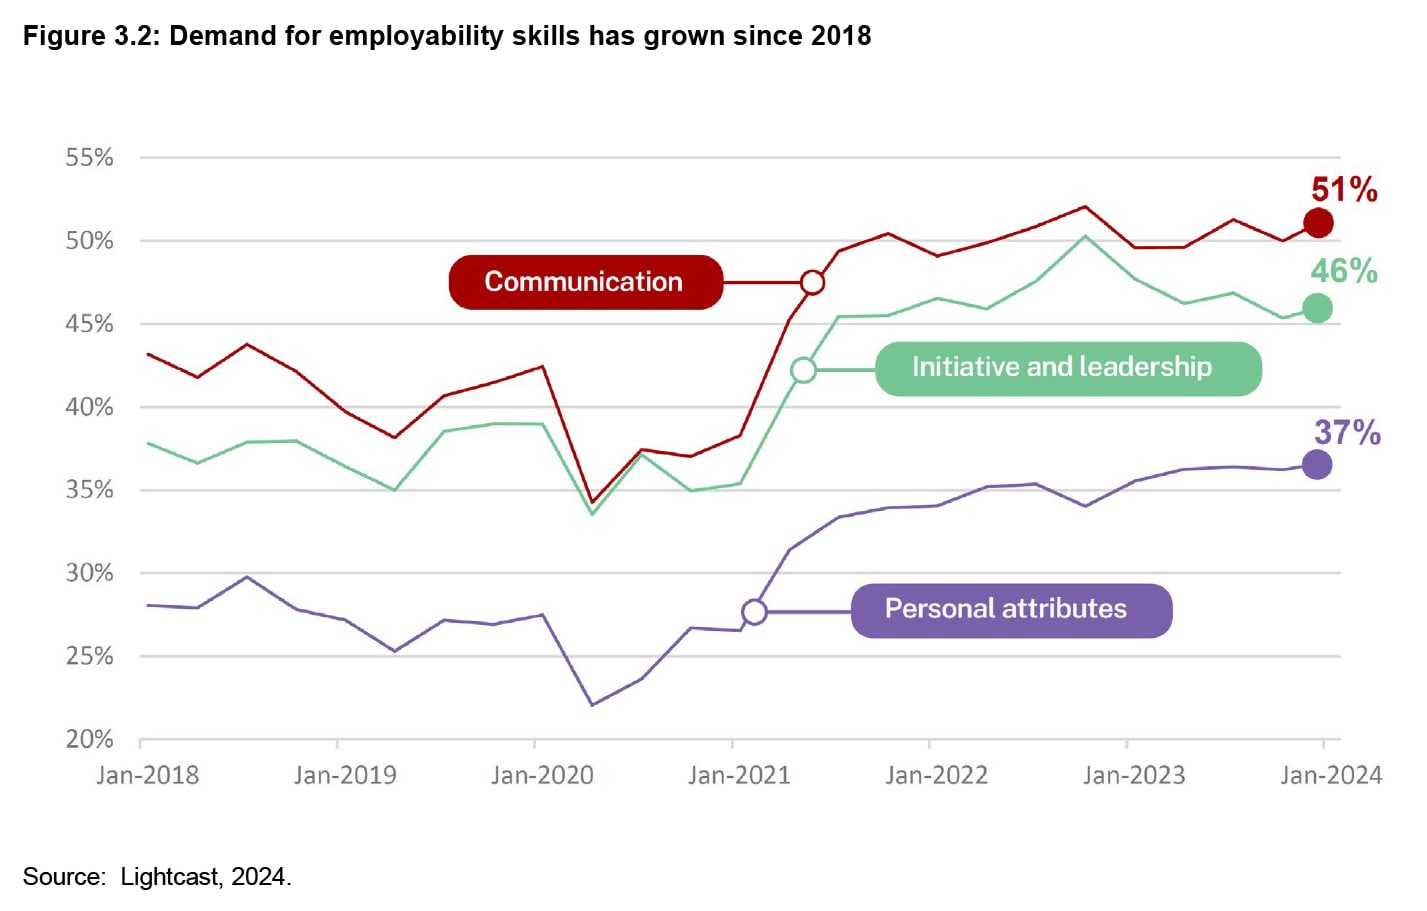
Interpersonal and intrapersonal skills have grown in importance since 2018. In 2024, about half of employers specify communication skills in their job advertisements. This is up from two in five in 2018. The importance of initiative and leadership and personal attributes have also increased since 2018.
Figure 3.2
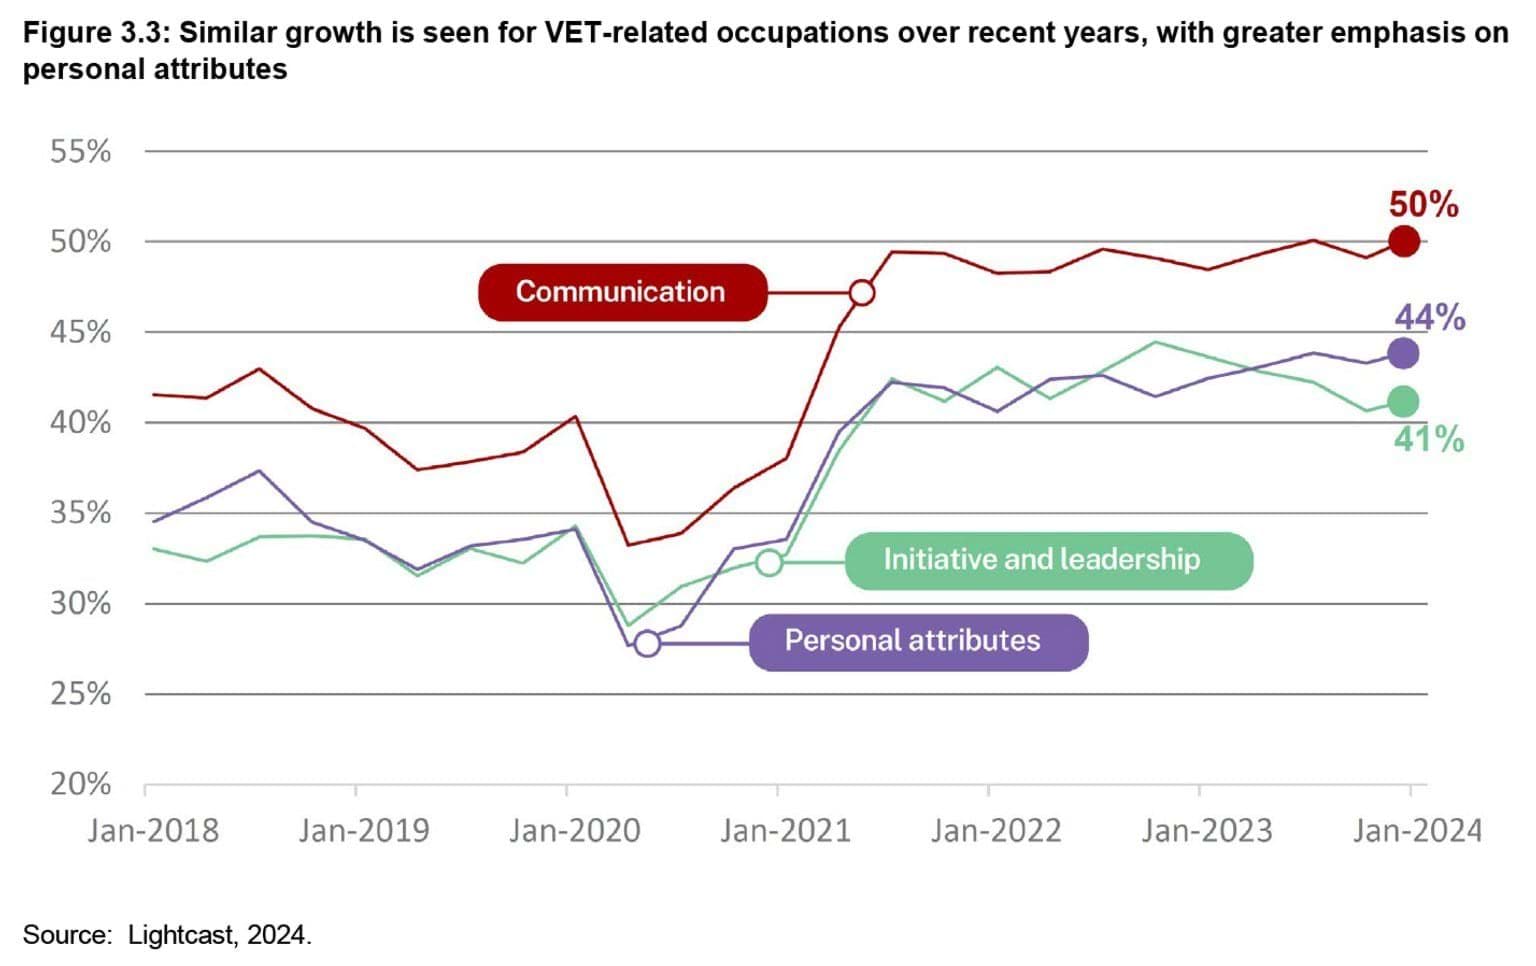
Similar patterns are observed for occupations where Vocational Education and Training (VET) is the most common pathway. Personal attributes are the second most-demanded, behind communication skills but ahead of initiative and leadership.
Figure 3.3
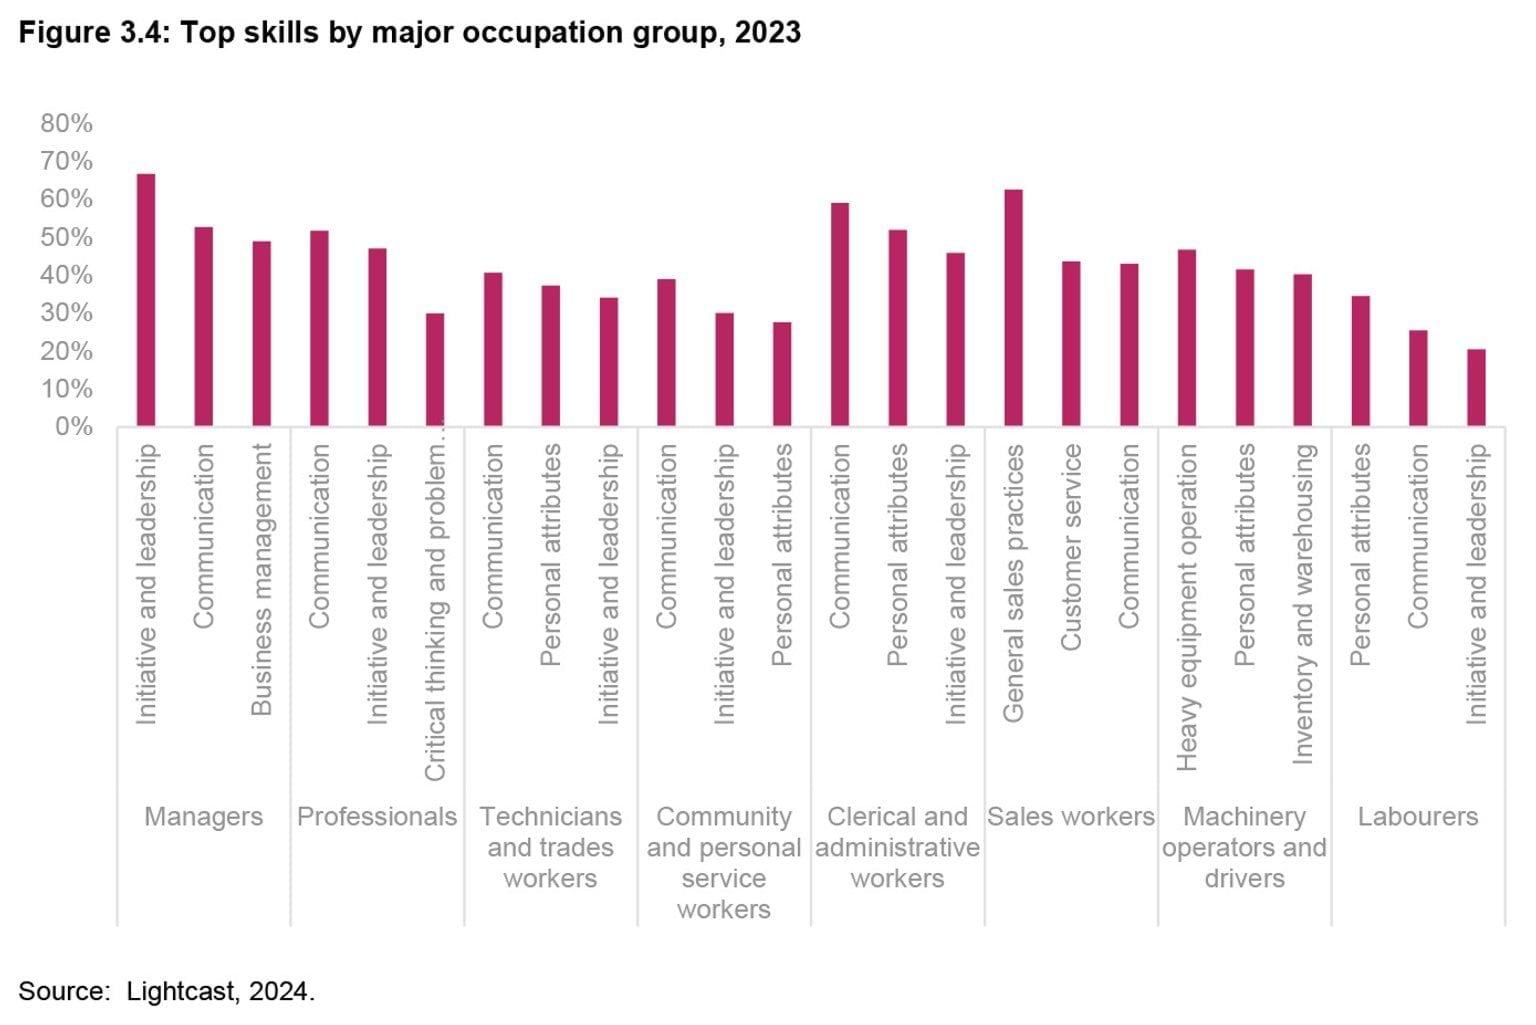
Across occupation groups, employers value employability skills but prioritise specific interpersonal and intrapersonal skills depending on the role. Communication is the top requested skill for four of the eight occupation groups, and second most requested for two other occupation groups.
Figure 3.4
Demand for clean economy skills is increasing
Online job advertisement data highlight the shift in skills required for the clean economy transition. While still a relatively small segment of the labour market, mentions of renewable energy-related skills more than doubled between 2018 and 2023.
Renewable energy-related skills are most common for manager, professional and technician and trades worker roles. Mentions of renewable energy skills have more than doubled for managers and professionals over the past five years and increased by more than 80 per cent for technicians and trades workers.
Among technician and trades worker roles, science technician, electrical engineering draftsperson and technician, electrical distribution trades worker, and electrician advertisements are most likely to mention renewable energy-related skills.
The fastest growing clean economy skills demanded are in air quality and emissions, conservation, and clean energy which are among the 10 fastest growing skill clusters across the whole labour market. Demand for water energy and climate change-related skills have also more than doubled.
Table 3.1: Air quality and emissions and conservation have been the fastest growing clean economy skills demanded
| Growth, 2018 to 2023 | |
|---|---|
| Air quality and emissions | 387% |
| Conservation | 257% |
| Clean energy | 222% |
| Water energy | 175% |
| Climate change | 127% |
Source: Lightcast, 2024.
4. Around 392,000 new workers are expected to enter the Victorian labour market by 2027
Victoria needs new workers to fill newly created jobs and vacancies created by retiring workers. Around 392,000 new workers are expected to join the Victorian workforce over the three years to 2027 and approximately 1,421,000 are expected over the decade to 2034. Of new workers expected:
- Around 168,000 new workers will be needed to fill new jobs expected to be created and another 224,000 new workers needed to replace retiring workers over 2024-27.
- About 630,000 new workers will be needed to fill new jobs and 791,000 new workers to replace retiring workers over 2024-34.
The Victorian Skills Authority (VSA) measure of new workers expected is not an estimate of labour demand or workforce shortages (which is presented elsewhere in this report). It is a measure of how much labour supply from workers is projected to meet labour demand from employers based on current trends and policy settings. It is a key tool in understanding future labour market and education and training requirements (see Appendix A for further information).
The employment projections in this report can be downloaded from the VSA’s website and from our Employment Projections Dashboard. The data are presented by industry, occupation and region.
Occupational skill level and alignment with educational attainment
The demand for VET and higher education graduates is expected to grow over the coming years. The Australian and New Zealand Standard Classification of Occupations (ANZSCO) assigns skill levels to each occupation to measure the level of skill typically required to perform tasks of a particular job competently, based on the level of formal education, previous work experience and on-the-job training. Each occupation is assigned a skill level between one and five, with skill level 1 corresponding with a higher education qualification and skill levels 2 to 4 with a VET qualification.
Figure 4.1: Main training pathway across occupational skill levels
| Qualification alignment | Skill level | Description |
|---|---|---|
| Higher education | Skill level 1 | a bachelor degree or higher |
| Vocational education and training (VET) | Skill level 2 | an associate degree, advanced diploma or diploma |
| Skill level 3 | Certificate III (including at least 2 years of on-the-job training) or Certificate IV | |
| Skill level 4 | Certificate II or III | |
| Other | Skill level 5 | Certificate I or compulsory secondary education |
There may be instances where previous work experience or on-the-job training for an occupation can substitute for formal qualifications, or cases where these elements may be required in addition to the qualification. The skill level of an occupation is therefore an indicative measure only of the qualification needed for the job.
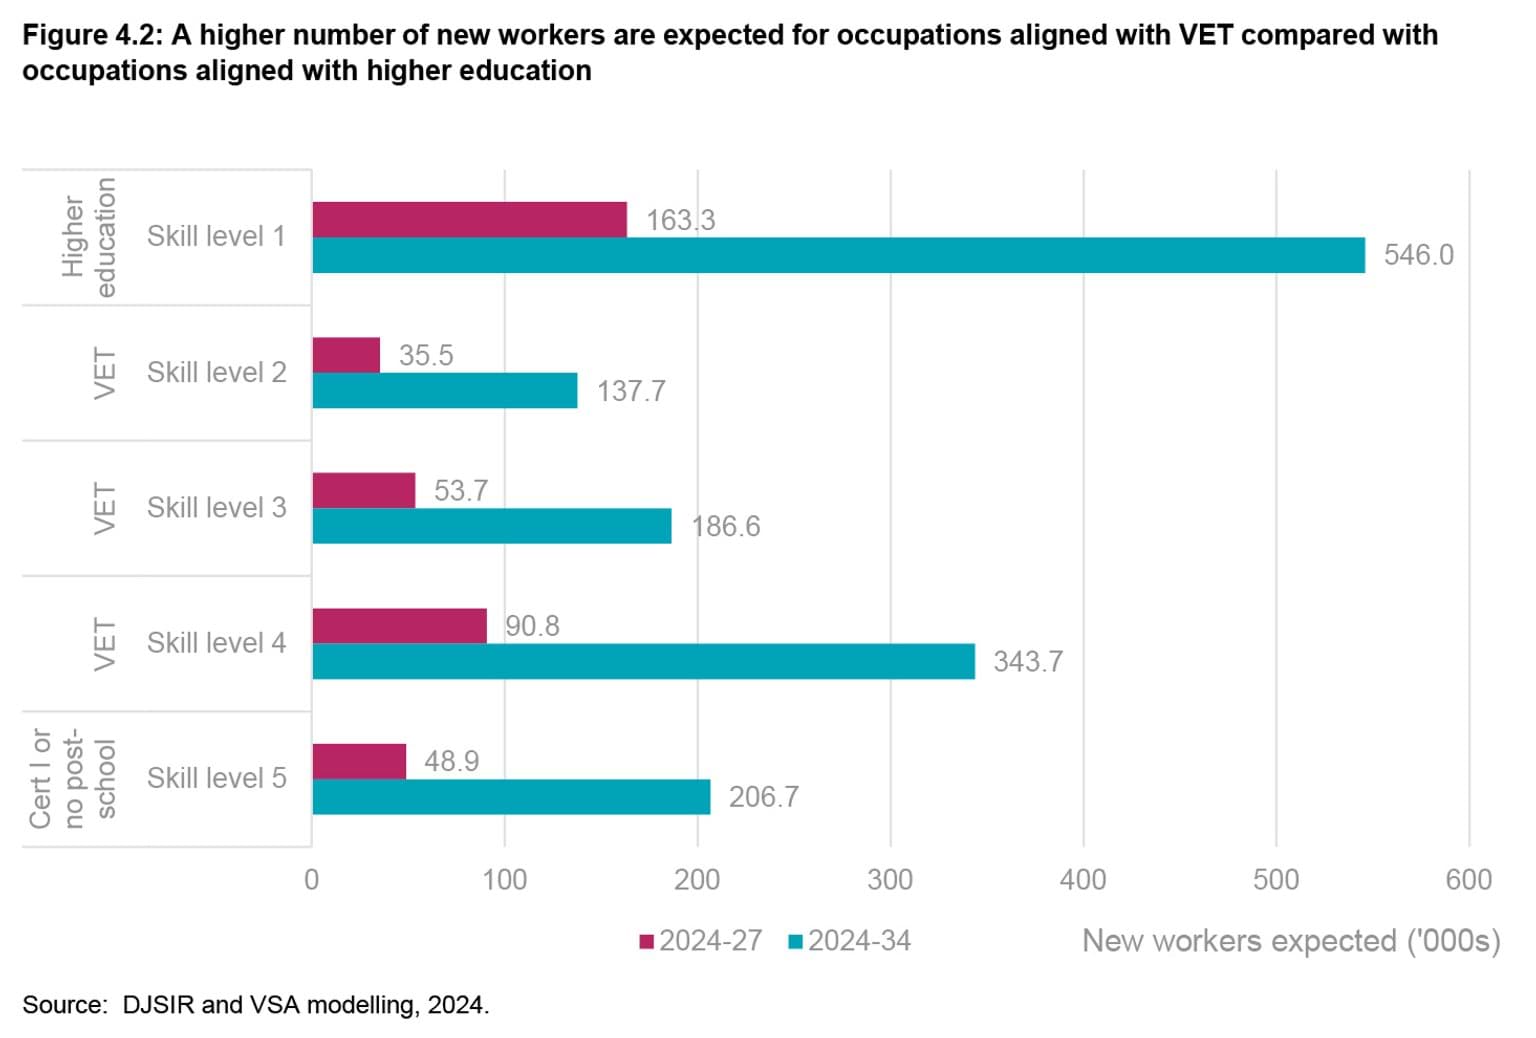
Around 163,000 new workers over the next three years (or 41.6 per cent of new workers) are expected to be needed in occupations associated with a higher education qualification (skill level 1). A higher number of new workers will be needed in occupations that are aligned to a VET qualification (skill levels 2 to 4), projected at 180,000 (45.9 per cent) over the same period.
Looking over the next decade through to 2034, about 546,000 new workers (38.4 per cent) are expected to gain employment in occupations aligned with higher education and a further 668,000 (47.0 per cent) are expected in occupations aligned with VET.
The higher share of new workers in VET-aligned occupations is largely due to the higher rates of retirement expected in these jobs, relative to occupations aligned with higher education.
The combination of VET and university-aligned occupations suggests that over the next decade, approximately 85 per cent of new workers expected in Victoria will need skill levels commensurate with a post-secondary school qualification to meet the state’s future skill needs (excluding Certificate I).
Figure 4.2
Health care and social assistance and construction are expected to have the most workforce growth
Health care and social assistance is expected to have the highest growth in new workers, increasing by 86,500 over the next three years (2024-27) and 335,000 over the next 10 years (2024-34). It represents almost a quarter of growth in new workers across all Victorian industries. The surge in the health care and social assistance workforce is not unique to Victoria and is also forecast to dominate growth at the national level.6
The next highest growth industries include:
- Construction
- 68,600 new workers expected over 2024-27; and
- 162,900 new workers expected over 2024-34.
- Professional, scientific and technical services
- 42,600 new workers expected over the 2024-27; and
- 141,000 new workers expected over 2024-34.
- Education and training
- 31,900 new workers expected over 2024-27; and
- 129,800 new workers expected over 2024-34.
The top four industries account for most of the new workers expected over the next three to 10 years, 59 per cent and 54 per cent, respectively.
The influences on employment growth vary across industry. Continued government spending is expected to support employment growth in health care and social assistance and education and training, through initiatives such as the National Disability and Insurance Scheme (NDIS) and the Best Start, Best Life reforms.
In particular, the Best Start, Best Life reforms are expected to drive significant additional demand for teachers and educators across the state as Three-Year-Old Kinder and Pre-Prep are rolled out.7
Significant funding from the Commonwealth Government into the aged care sector in response to the Royal Commission into Aged Care Quality and Safety, including funding to support modern award minimum wage increases by the Fair Work Commission of up to 28.5 per cent for direct care employees and other workers, will help attract and retain the aged care workforce.8
The 2024/25 Victorian Budget also includes a record $13 billion to support hospitals and other health services, and upgrade health care facilities.9
Investment in residential construction is expected to increase considerably and lead to significant demand for workers in construction and related industries in order to deliver on the objectives of the Housing Statement. Victoria’s Big Build and other public infrastructure projects also mean that construction activity and demand for workers will remain elevated for some time.
Growth across all other Victorian industries is expected to be positive. The professional, scientific and technical services industry is expected to grow above average, continuing a trend towards an increasingly knowledge-driven and professional workforce. Software and applications programmers, ICT managers and other ICT-related roles in the industry are expected to have strong growth to help service the digital transformation of the economy. Civil engineering professionals; and architects and landscape architects are also contributing to industry growth to service the needs of the construction sector.
Retail trade, which is Victoria’s fourth largest industry, is also expecting a high number of new workers to replace those that retire, particularly over the next 10 years. However, excluding retirements, employment growth is anticipated to be slightly below average as retailers become more automated and as customers move increasingly towards online shopping.
Figure 4.3

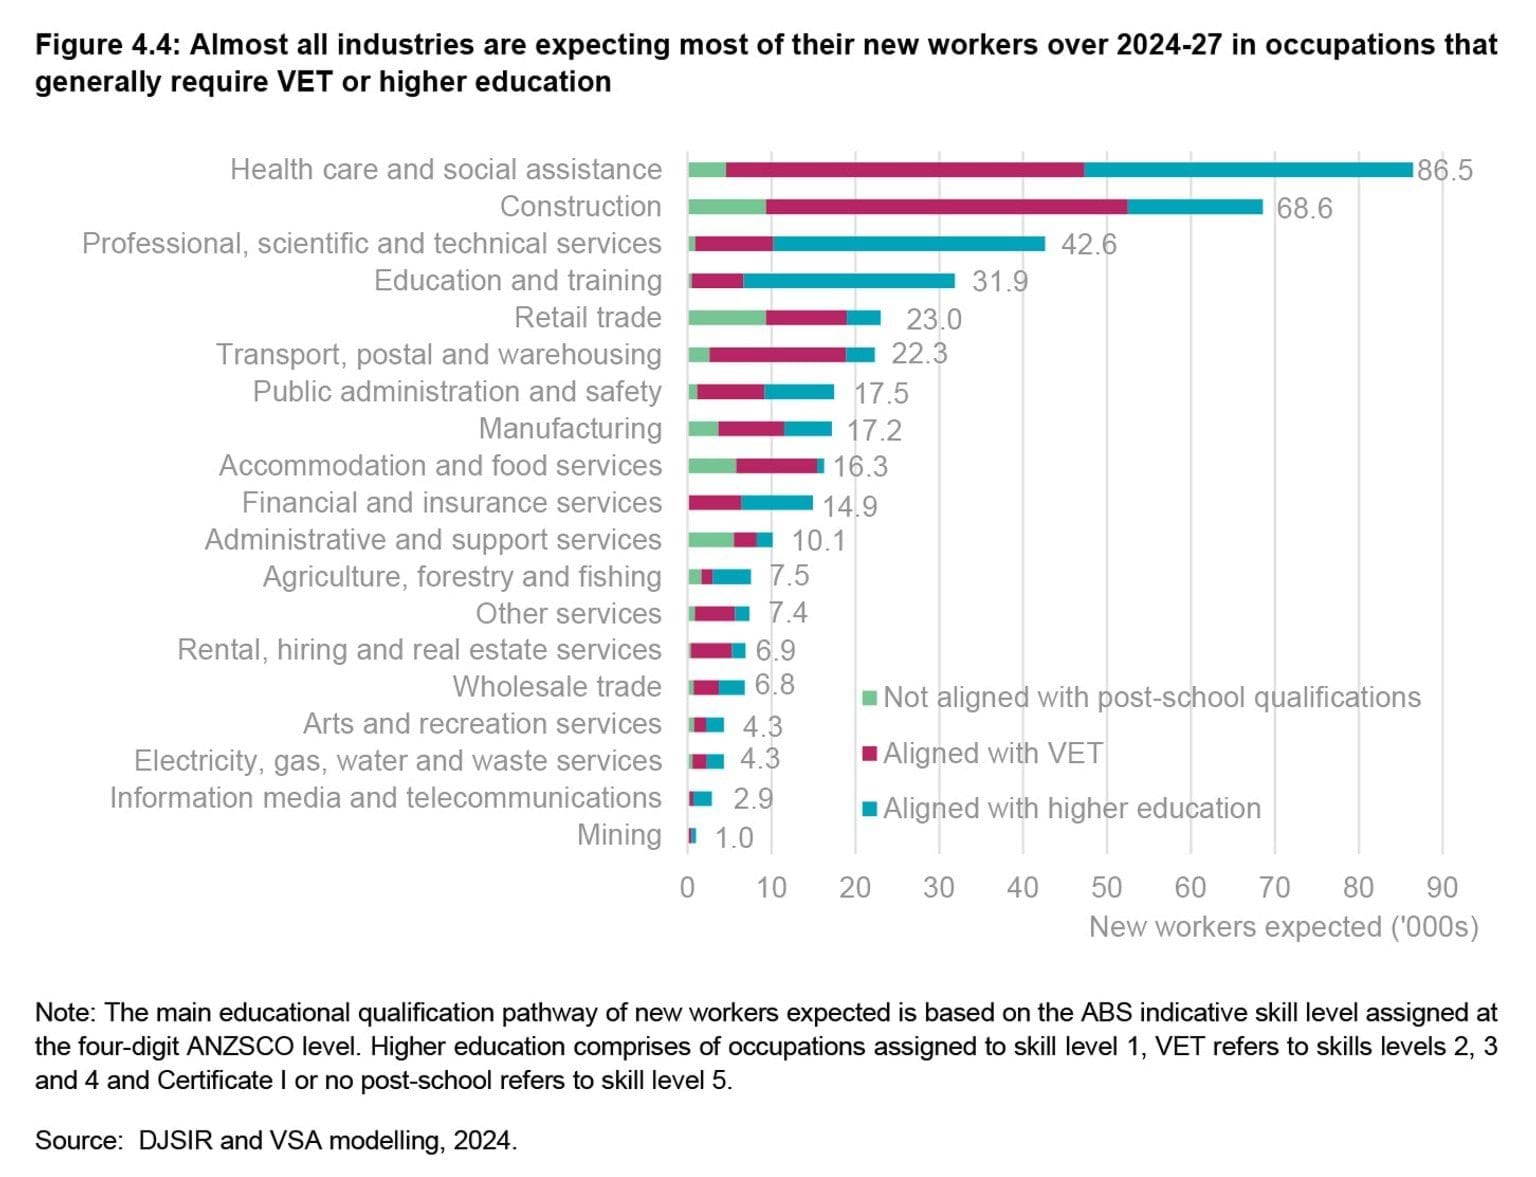
Out of the 19 industries, 10 have higher education as the most common primary qualification pathway for new workers, and eight have VET as the most common primary pathway.
Over 70 per cent of new workers expected in the transport, postal and warehousing and rental, hiring and real estate services are in occupations that generally require a VET qualification, the highest among the industries.
Construction also has a relatively large share of new workers expected in occupations that generally require VET qualifications at 63 per cent (this includes apprentices). Around half of new workers expected in health care and social assistance will be in VET-aligned occupations.
Figure 4.4
Table 4.1: Occupations in demand aligned with VET and higher education across selected industries, 2024-27
Table 4.1 shows the top 10 fastest growing industries over 2024-27 and, within each, the top four VET and higher education-aligned occupations that are expected to be in high demand. New workers expected for ageing and disability carers and registered nurses in health care and social assistance greatly exceed other occupations among these selected industries.
| Top 10 industries (2024-27) | Top four occupations (2024-27) | New workers expected (2024-27) |
|---|---|---|
| Health care and social assistance | Ageing and disability carers* | 12,500 |
| Registered nurses | 11,100 | |
| Receptionists* | 4,800 | |
| Nursing support and personal care workers* | 4,100 | |
| Construction | Construction managers | 7,700 |
| Carpenters and joiners* | 6,100 | |
| Electricians* | 4,500 | |
| Plumbers* | 3,500 | |
| Professional, scientific and technical services | Software and applications programmers | 4,100 |
| Accountants | 3,400 | |
| ICT managers | 1,700 | |
| Civil engineering professionals | 1,700 | |
| Education and training | Primary school teachers | 6,500 |
| Secondary school teachers | 5,800 | |
| Education aides* | 2,200 | |
| Private tutors and teachers | 1,900 | |
| Retail trade | Retail managers* | 2,500 |
| Storepersons* | 1,200 | |
| Motor vehicle and vehicle parts salespersons* | 800 | |
| Pharmacists | 600 | |
| Transport, postal and warehousing | Truck drivers* | 3,500 |
| Automobile drivers* | 2,800 | |
| Storepersons* | 1,700 | |
| Delivery drivers* | 1,300 | |
| Public administration and safety | Security officers and guards* | 1,400 |
| Police* | 1,300 | |
| General clerks* | 800 | |
| Inspectors and regulatory officers | 600 | |
| Manufacturing | Production managers | 1,100 |
| Cabinetmakers* | 1,000 | |
| Structural steel and welding trades workers* | 700 | |
| Metal fitters and machinists* | 600 | |
| Accommodation and food services | Waiters* | 1,800 |
| Chefs* | 1,500 | |
| Cafe and restaurant managers* | 1,300 | |
| Bar attendants and baristas* | 1,000 | |
| Financial and insurance services | Financial investment advisers and managers | 1,600 |
| Financial brokers* | 1,300 | |
| Bank workers* | 1,100 | |
| Credit and loans officers* | 800 |
Note: * Designates occupations whose main education and training pathway are aligned with a VET qualification (skill levels 2 to 4). Table only presents the top 10 industries in terms of new workers expected in 2024-27.
Source: DJSIR and VSA modelling, 2024.
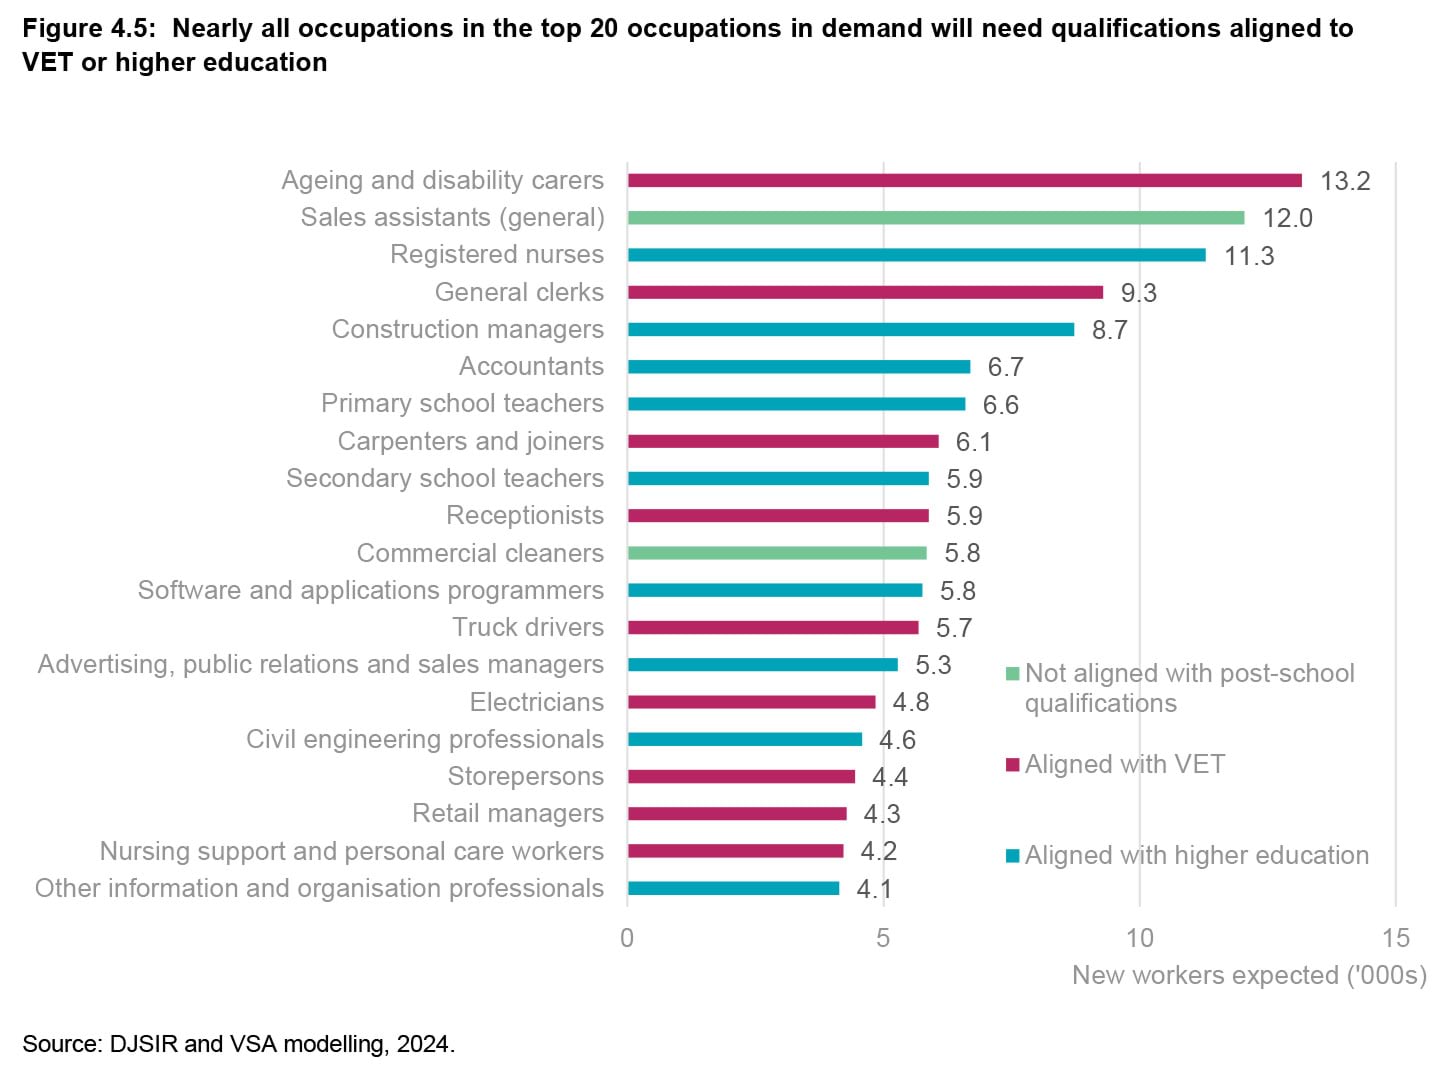
High growth for occupations in the care economy and construction
Occupations in the care economy and construction feature prominently in the top occupations in demand. For example, ageing and disability carers and registered nurses are ranked first and third in terms of new workers expected over 2024-27. Occupations relevant to construction, such as construction managers and carpenters and joiners, also feature prominently.
Figure 4.5

Strong demand for workers in metropolitan Melbourne and regional Victoria will continue
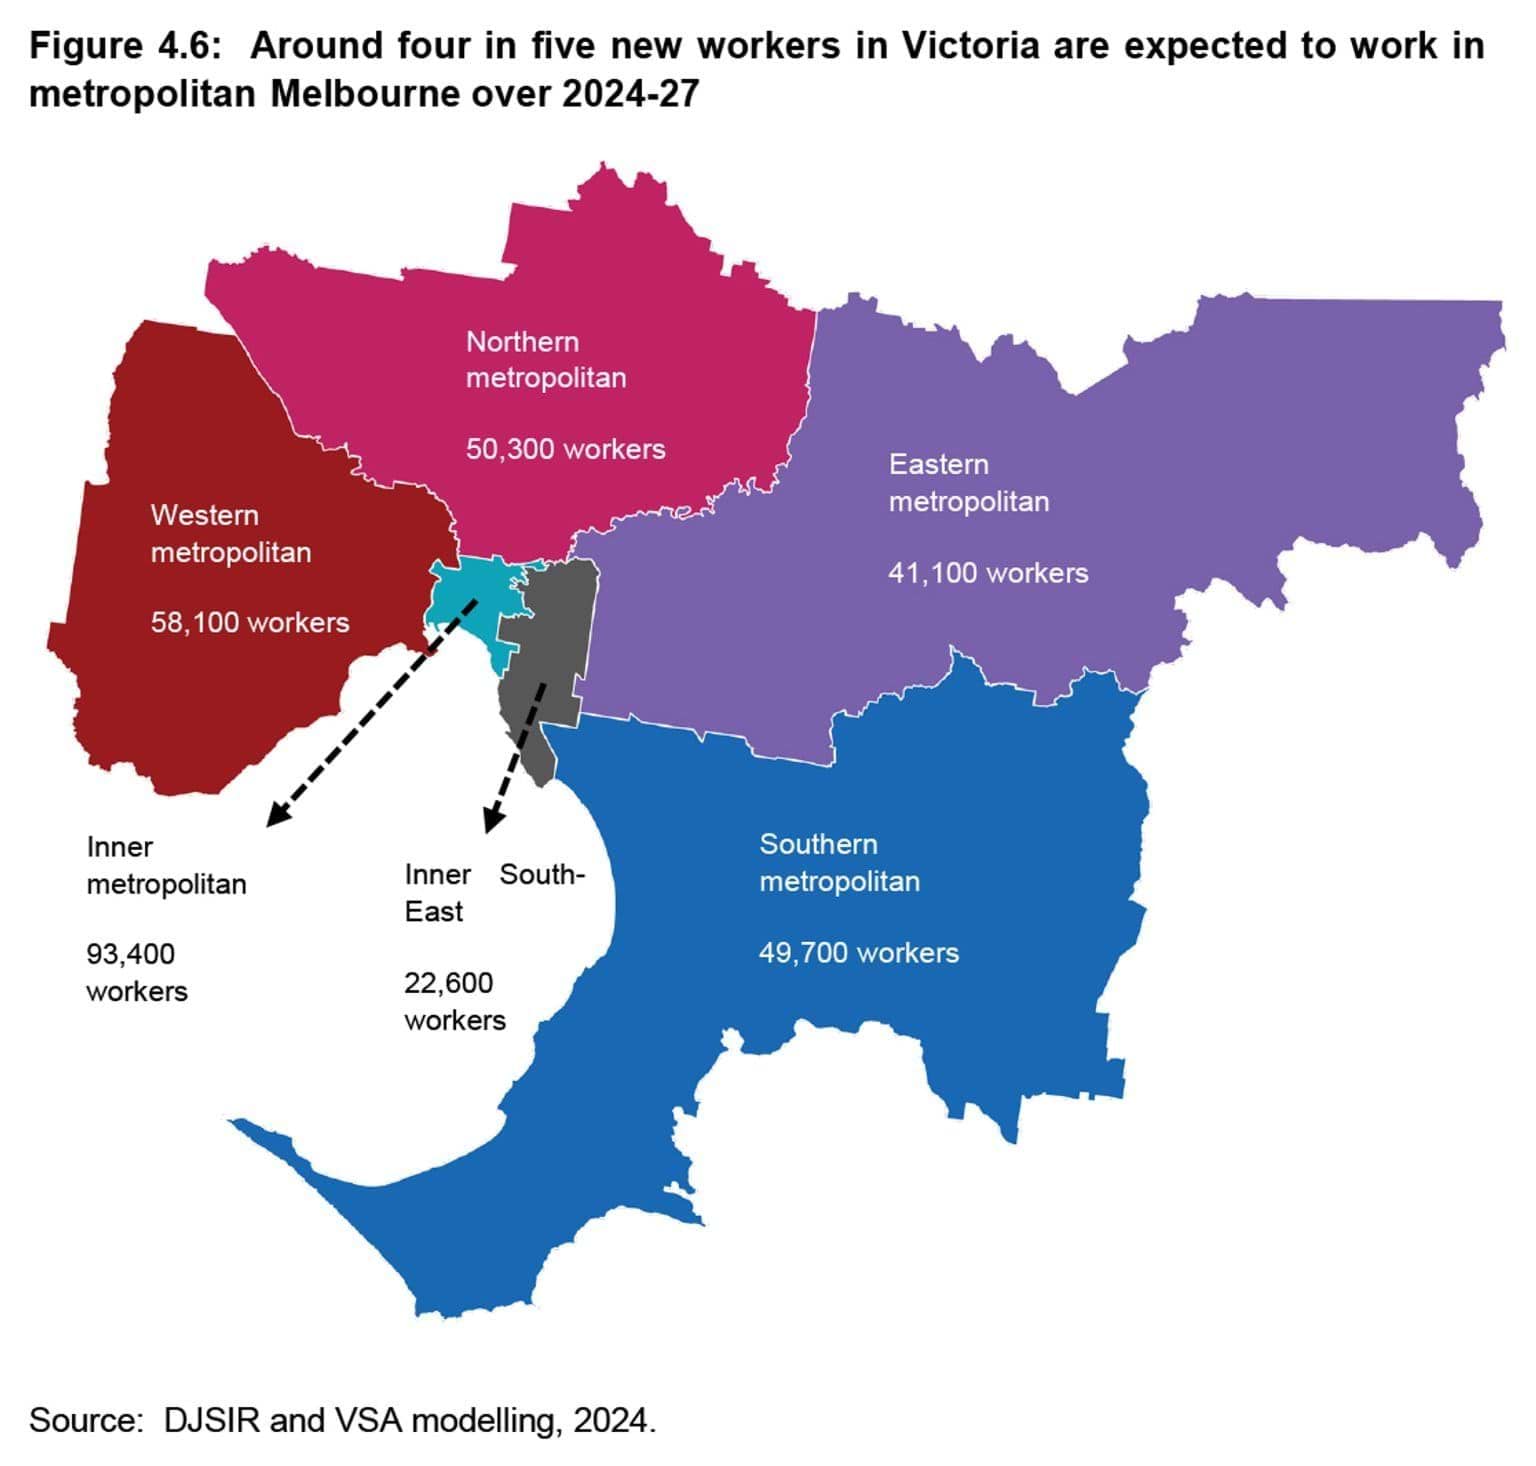
Metropolitan Melbourne is expected to account for around 80.4 per cent of new workers expected (or 315,000 workers) in Victoria over the next three years to 2027.
The inner metropolitan (29.6 per cent) and western metropolitan (18.4 per cent) areas will account for the highest proportion of new workers expected in metropolitan Melbourne through to 2027. About 45.2 per cent of new workers in metropolitan Melbourne will be in occupations aligned with a VET qualification.
Figure 4.6
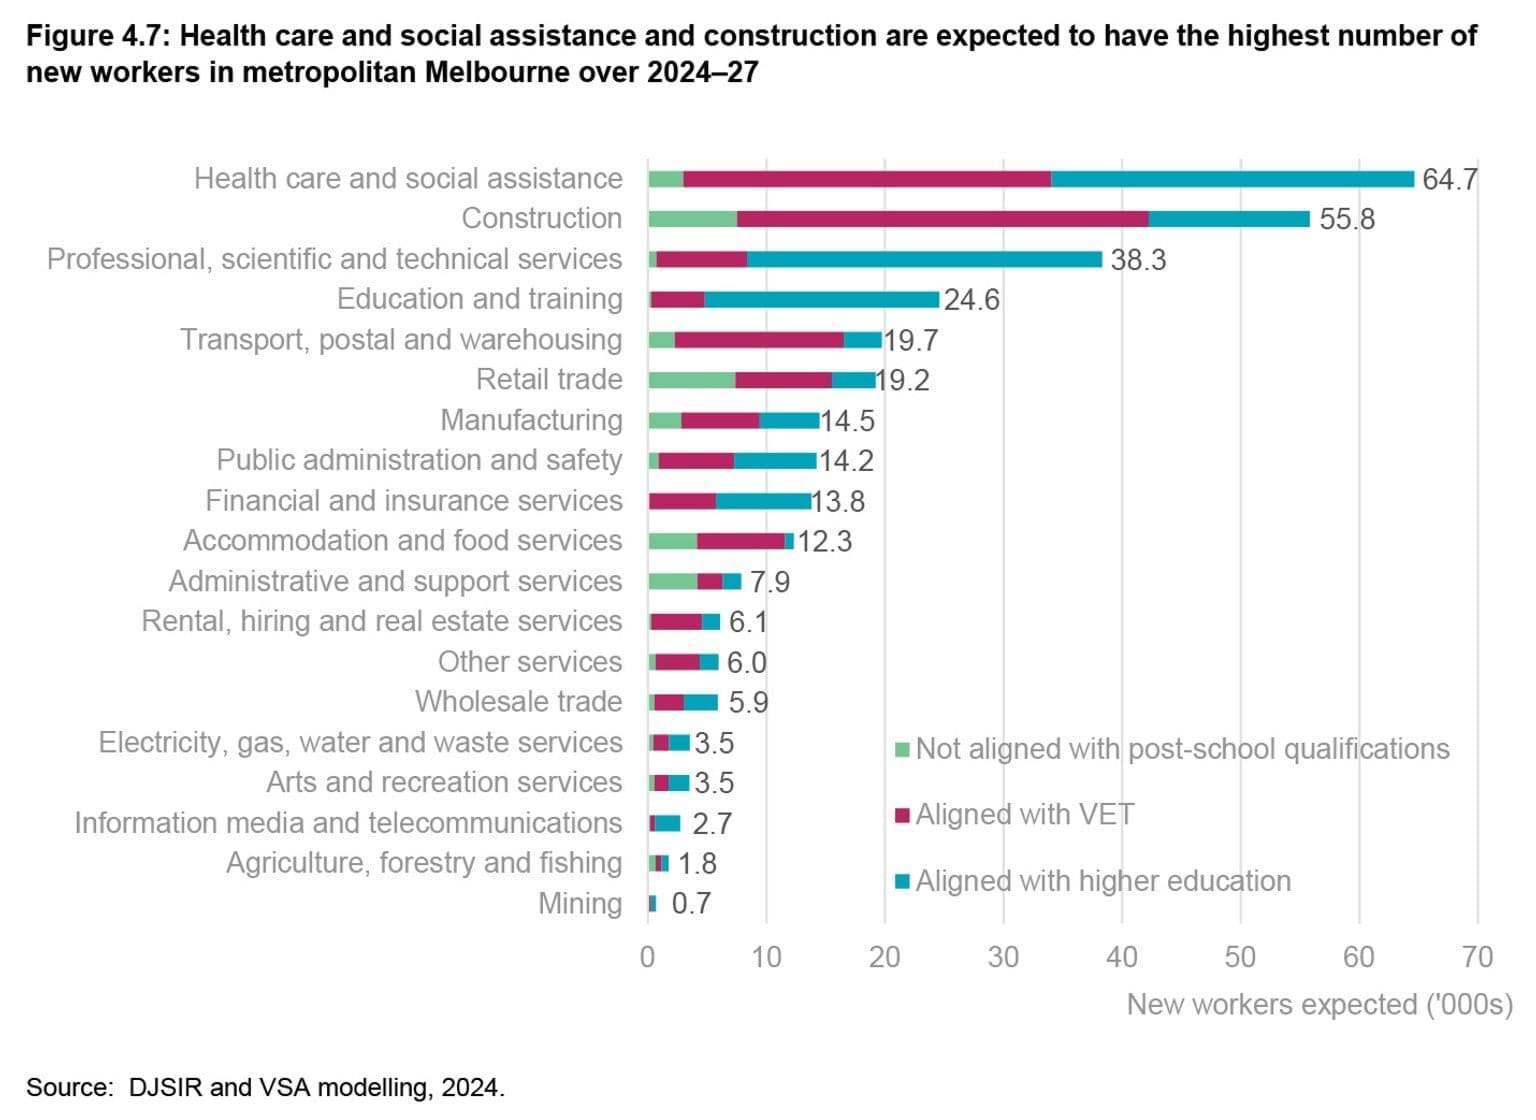
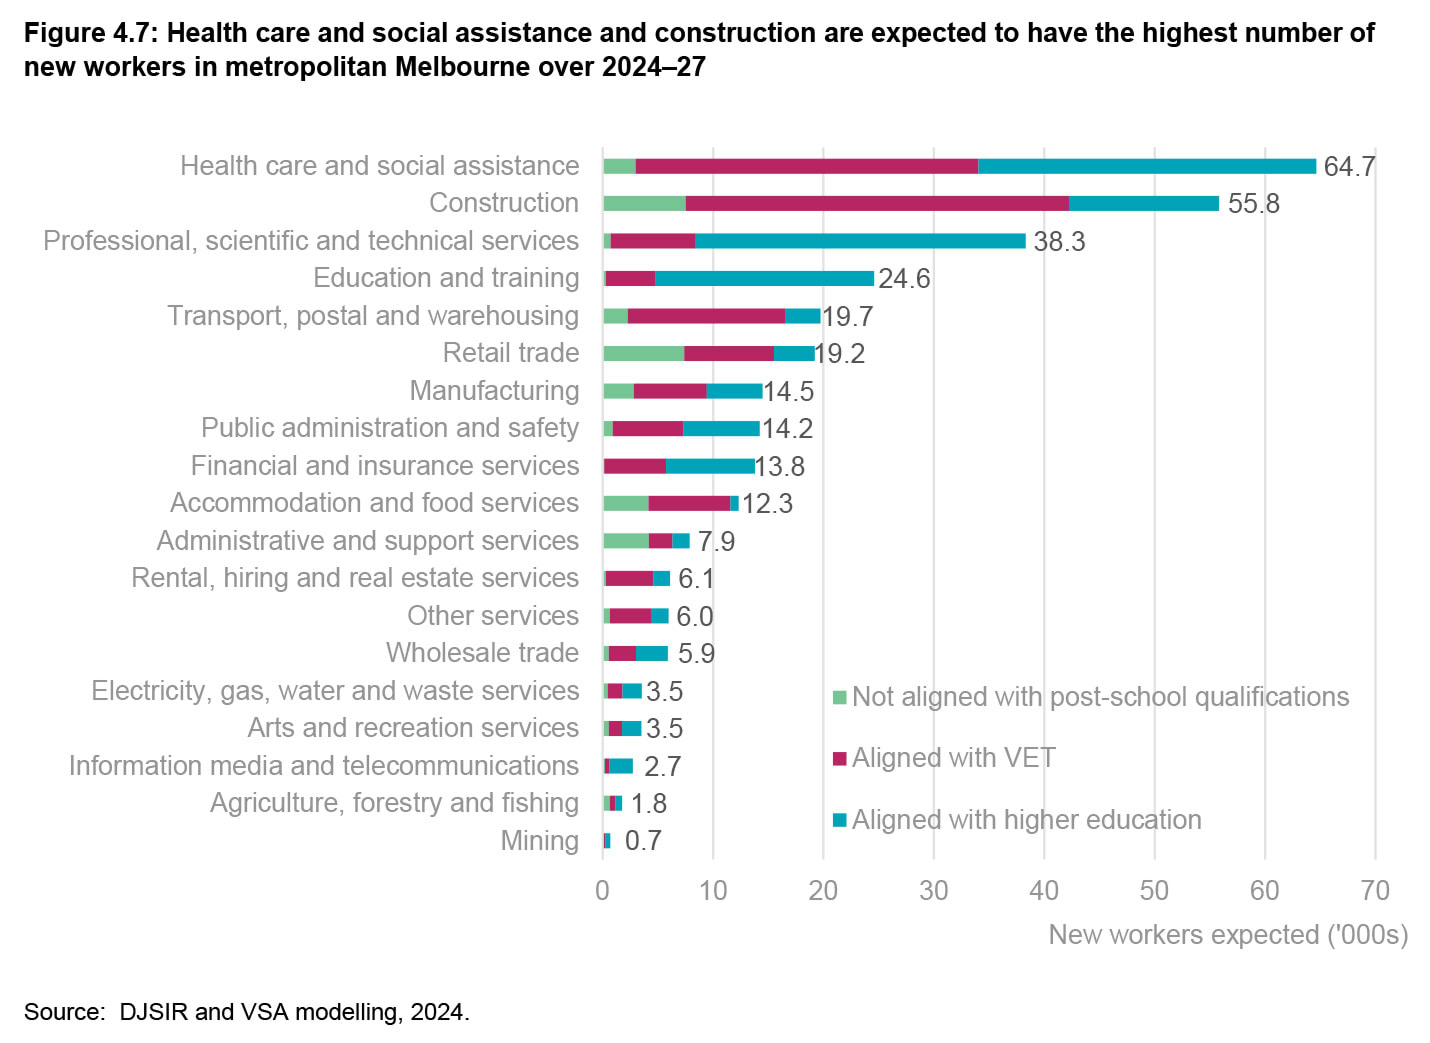
Health care and social assistance (64,700) and construction (55,800) have the highest number of new workers expected across metropolitan Melbourne over the next three years to 2027.
Figure 4.7
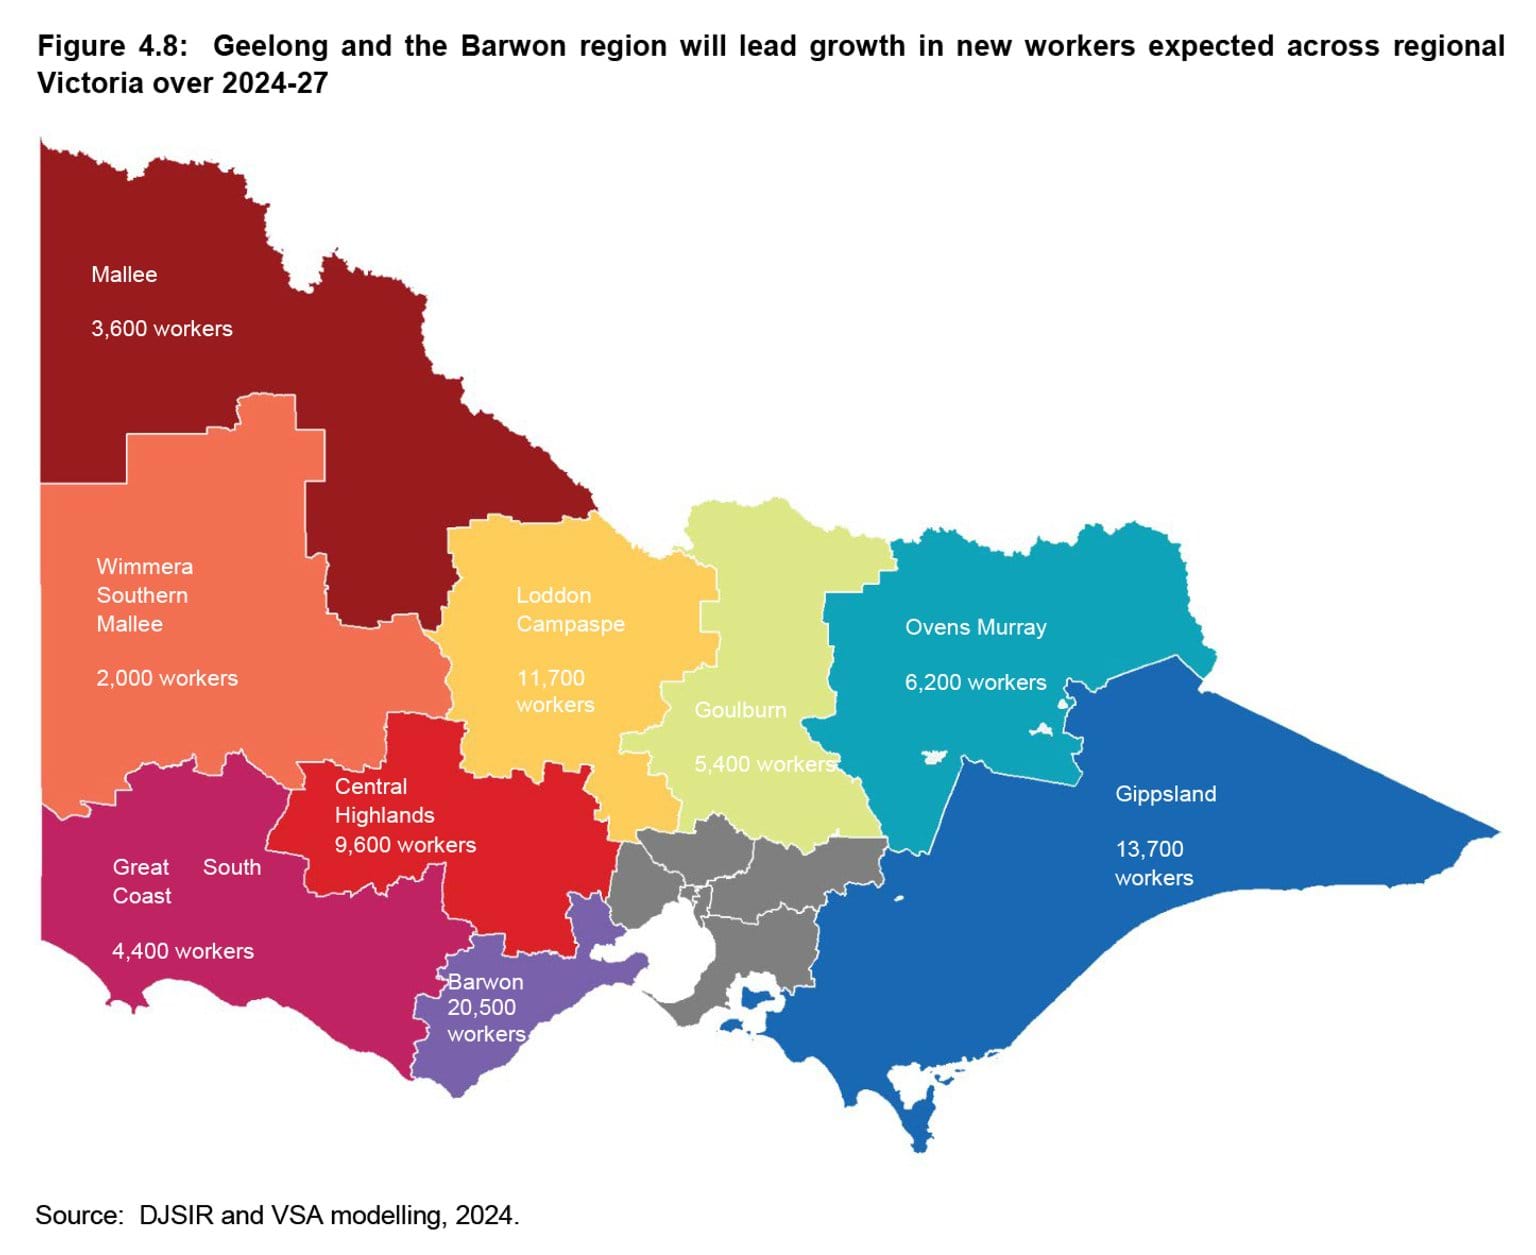
Regional Victoria will account for 19.6 per cent (or 77,000) of new workers expected in Victoria over the next three years to 2027.
The regions accounting for the highest number of new workers across regional Victoria include Barwon (26.6 per cent), followed by Gippsland (17.7 per cent), Loddon-Campaspe (15.1 per cent), and Central Highlands (12.4 per cent).
Around 48.6 per cent of new workers expected in regional Victoria will be in VET-aligned occupations.
Figure 4.8
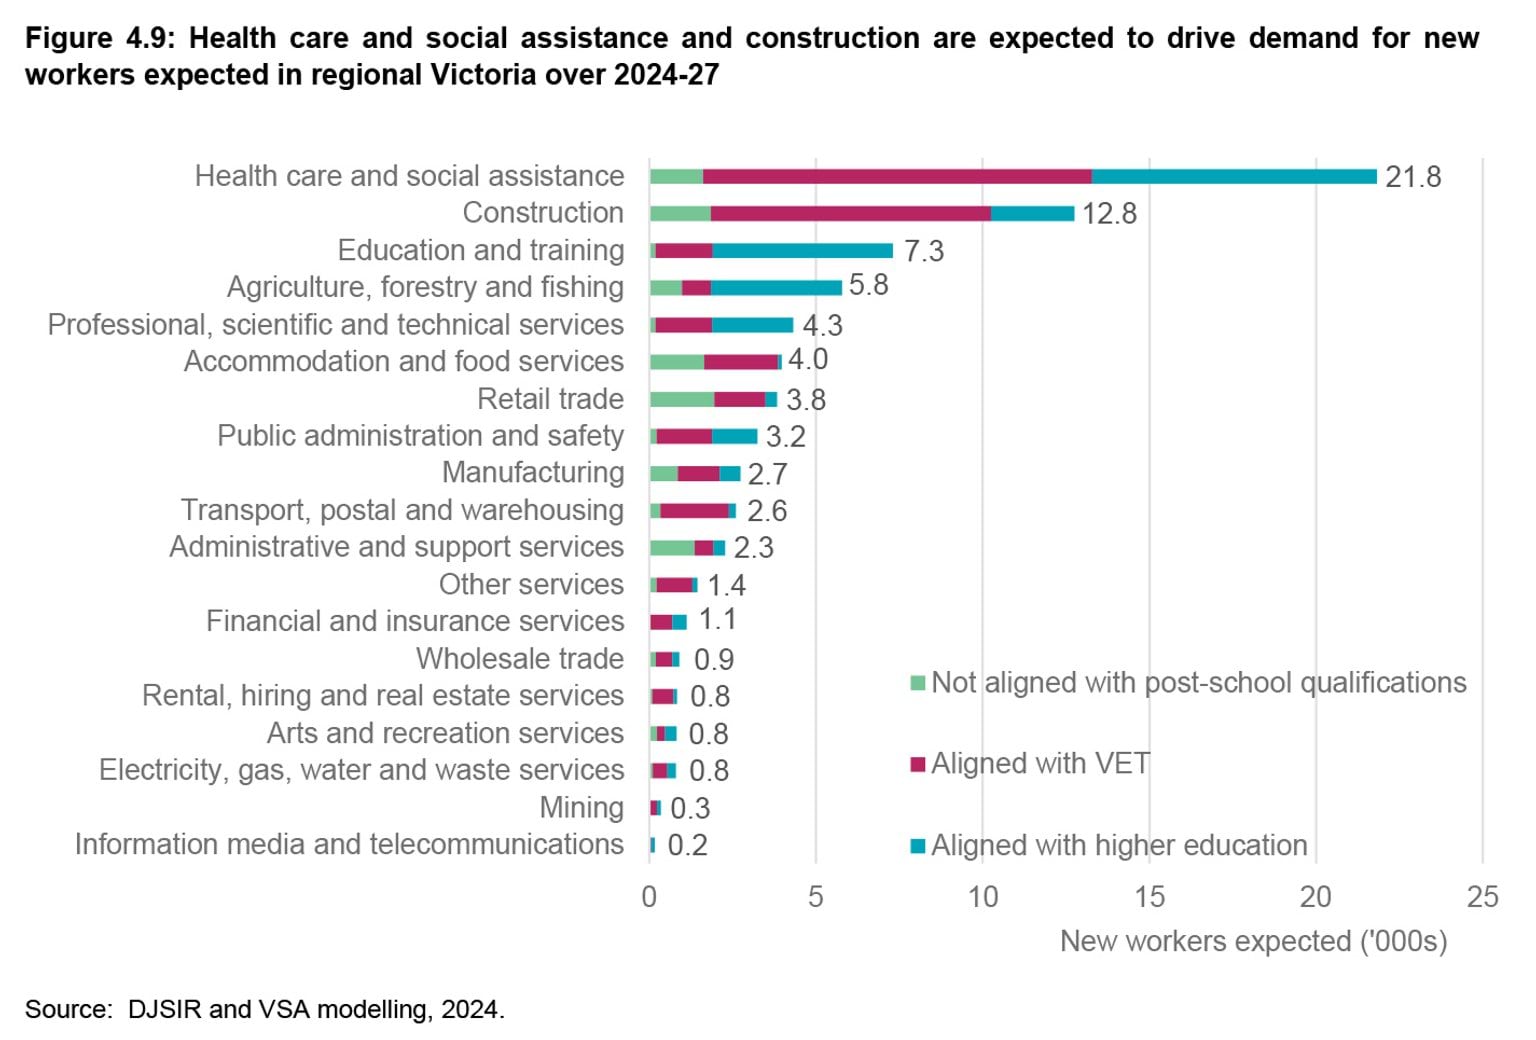
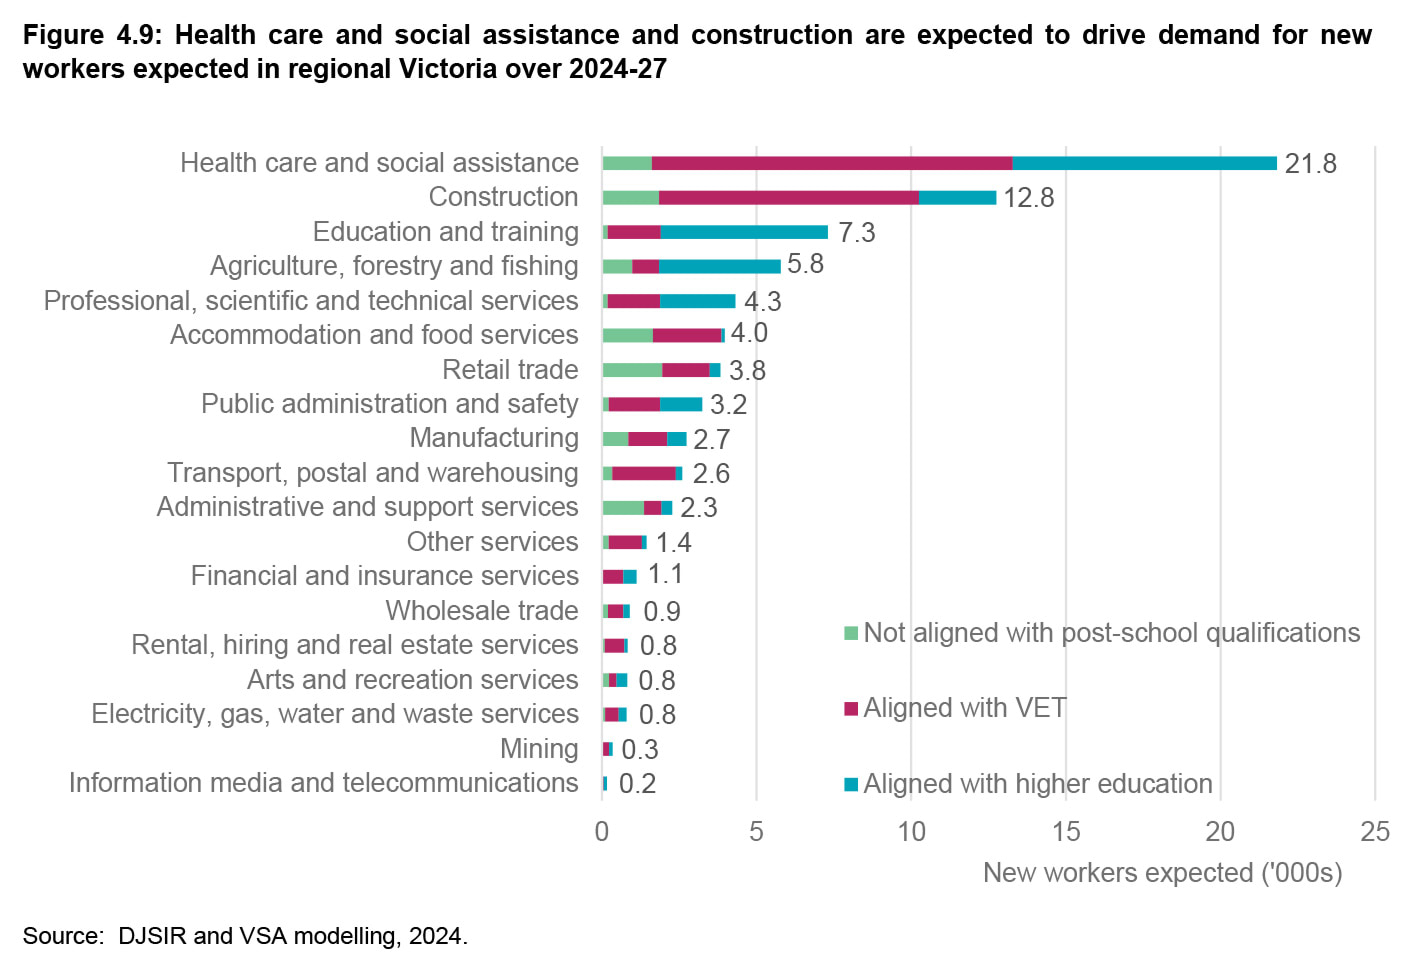
Over the next three years, growth in new workers across regional Victoria is expected to be concentrated in health care and social assistance, accounting for 28.3 per cent of new workers (21,800). The next highest industry is construction, accounting for 16.6 per cent of new workers (12,800).
Figure 4.9
5. The Victorian Government housing and infrastructure agenda will involve significant demand for workers
The Victorian Government’s transformative infrastructure agenda includes the Housing Statement, Big Build and the renewable energy transition. The 2024/25 Victorian Budget committed $208 billion to new and existing capital projects, making it one of the largest infrastructure programs in the world.10
Last year’s Housing Statement announced a target to build hundreds of thousands of new homes over the next decade to provide Victorians with more social and affordable housing in locations close to jobs and transport. Victoria’s Big Build is well underway, delivering critical infrastructure to reshape Victoria’s transportation network and deliver on new education, health care and other facilities.
Victoria’s infrastructure commitments mean that workforce demands in construction and across the supply chain will remain high over the next ten years.
The industry is facing challenges attracting and retaining women. In May 2024, women account for only 14.0 per cent of all workers in construction in Victoria, up from 9.8 per cent in May 2014, but still well below the state-wide average of 47.3 per cent.11 To encourage more women to participate in construction, the Australian Skills Guarantee has introduced national targets from July 2024 to increase the proportion of apprenticeship/traineeship hours worked by women on major construction projects. Victoria had earlier established a similar policy under the Building Equality Policy. Efforts to make a more inclusive industry will help address capability and ease capacity constraints.
162,900 new workers are expected to gain employment in construction over the next 10 years
Around 162,900 new workers are expected to join the construction industry between 2024 and 2034.
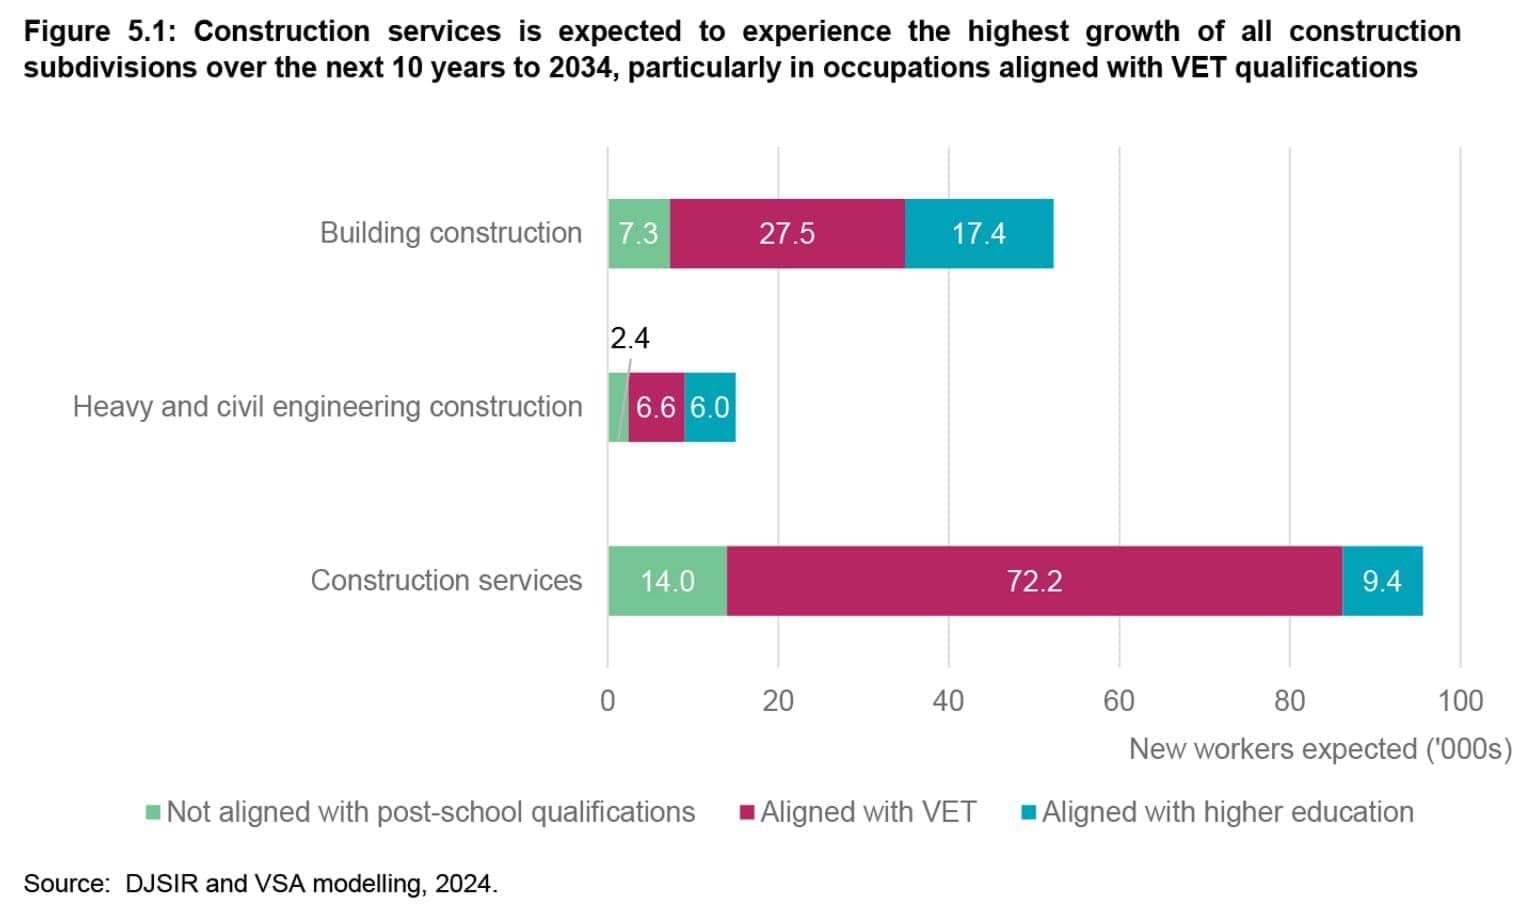
Over the next 10 years, most new workers, around 95,600, will be in the construction services industry subdivision12, followed by building construction (52,300 new workers); and heavy and civil engineering construction (15,000 new workers).
About 65.2 per cent of new workers in construction are expected to gain employment in occupations that are generally serviced by VET but this varies significantly by subdivision. For example, in construction services and building construction, around 75 per cent and 53 per cent, respectively, will be in occupations that generally require VET. In heavy and civil engineering construction, around 44 per cent of new workers are expected in occupations that generally require VET.
Figure 5.1
Occupations in demand across construction include construction managers, electricians, carpenters and joiners, and plumbers. Across the construction industry subdivisions, this varies significantly, ranging from construction managers in building construction and heavy and civil engineering construction, to electricians and plumbers in construction services.
Table 5.1: Occupations in demand by construction industry subdivisions over 2024-34
| Construction industry subdivision | Employment 2024 | New workers expected (2024-34) | Top four occupations |
|---|---|---|---|
| Building construction | 100,900 | 52,300 | Construction managers Carpenters and joiners* Architectural, building and surveying technicians* Building and plumbing labourers |
| Heavy and civil engineering construction | 32,100 | 15,000 | Civil engineering professionals Earthmoving plant operators* Construction managers Building and plumbing labourers |
| Construction services | 234,200 | 95,600 | Electricians* Plumbers* Painting trades workers* Carpenters and joiners* |
| All construction | 367,200 | 162,900 | Construction managers Carpenters and joiners* Electricians* Plumbers* |
Note: * Designates occupations whose main education and training pathway are aligned with a VET qualification (skill levels 2 to 4).
Source: DJSIR and VSA modelling, 2024.
Appendix A: Employment projections methodology
The Victorian Skills Plan for 2024 into 2025 projects employment growth, retirements and new workers expected over the next 10 years using modelling from the Department of Jobs, Skills, Industry and Regions (DJSIR) and the VSA.
- Employment is the estimated number of workers employed in an industry, occupation and/or region.
- Employment growth is the projected change in employment between years in an industry, occupation or region. Employment growth (or decline) comes as business, government and other employers expand (or contract) their operations.
- Employment growth rate is the projected annual rate of growth in employment. It is calculated as a compounded annual growth rate (CAGR).
- Retirements is the number of workers over 50 years of age projected to leave the workforce.
- New workers expected is employment growth plus retirements. It is an estimate of how many workers will enter the workforce across industries, occupations and regions. New workers fill new jobs created by employers, and as employers look to replace retirees who leave the workforce.
Employment growth and new workers expected are not estimates of labour demand or skill shortages. Rather, they are measures of how much labour supply (from workers) is projected to meet demand (from employers). Some labour demand will be unmet and some labour supply will not be taken up by employers (this is also known as unemployment). The presence of skill shortages depends on how much labour demand is unmet. It is measured separately and may be present in jobs with both high or low numbers of new workers expected.
Employment, employment growth and the employment growth rate come from DJSIR’s employment projections. DJSIR uses an exponential smoothing (ETS) model to project changing industry and occupation shares of employment. The ETS technique takes weighted averages of past observations, which decay exponentially as observations get older. DJSIR then distributes the projected shares across industry, occupation and region matrices using iterative proportional fitting.
The projections are benchmarked to aggregate employment forecasts in the 2024/25 Victorian Budget and Victoria in Future 2023 population projections. Some adjustments were made to better reflect expected employment, including the impacts of key policies such as the Housing Statement and Best Start, Best Life reforms.13
Retirements and new workers expected come from the VSA’s Employment Model. The VSA estimates retirements, and other labour market flows using econometric analysis of linked ATO income tax data and longitudinal census data from the ABS Person Level Integrated Data Asset (PLIDA) showing the changes in employment and occupation status between years.
Industries are based on the Australian and New Zealand Standard Industrial Classification (ANZSIC). Occupations are based on the Australian and New Zealand Standard Classification of Occupations (ANZSCO). Regions are groupings of local government areas (LGAs) that align to the Victorian Government’s Regional Partnerships and former Metropolitan Partnerships. Estimates reflect the place of work of the employee, rather than the place of residence.
The projections benefited from extensive consultation across the Victorian Government. They incorporate the feedback and expertise from a variety of departments including the Department of Treasury and Finance, Department of Premier and Cabinet, Department of Education, Department of Energy, Environment and Climate Action, Department of Health, and the Department of Transport and Planning.
References
- ABS, Labour Force, Australia, Detailed, June 2024.
- Eight occupations were not given a skill shortage rating due to insufficient data being available to assess this.
- Internal VSA analysis using JSA datasets (Survey of Employers who have Recently Advertised, Skills Priority List, Nowcast of Employment by region), and Lightcast.
- Internal VSA analysis using JSA datasets (Survey of Employers who have Recently Advertised, Skills Priority List, Nowcast of Employment by region), and Lightcast.
- Not all drivers of shortage for occupations fit neatly into one category. For example, an occupation may be simultaneously experiencing a lack of qualified applicants and a large amount of turnover. Therefore, the workforce shortage driver for the occupation is the one that is the primary driver of shortage.
- JSA (2023), Annual Jobs and Skill Report 2023(opens in a new window).
- Victorian Government (2024), Strategy and Outlook 2024-25, Budget Paper No. 2(opens in a new window), p. 48.
- [2024] FWCFB 150(opens in a new window); The Hon. Mark Butler (2024), Budget 2024-25: Investing in quality aged care(opens in a new window), Media release.
- Victorian Government (2024), Record investment in frontline care(opens in a new window), Victorian Budget 2024/25.
- Department of Treasury and Finance (2024), Helping families, Strategy and Outlook, Budget Paper No. 2(opens in a new window), p. 61.
- ABS, Labour Force, Australia, Detailed, June 2024; ABS, Labour Force, Australia, June 2024.
- The construction services subdivision under ANZSIC includes the industry groups, land development and site preparation services; building structure services; building installation services, building completion services and other construction services.
- The number of Early Childhood (Pre-Primary School) Teachers does not reflect recent changes to the rollout schedule of the Best Start, Best Life reforms announced as part of the 2024/25 Victorian Budget.