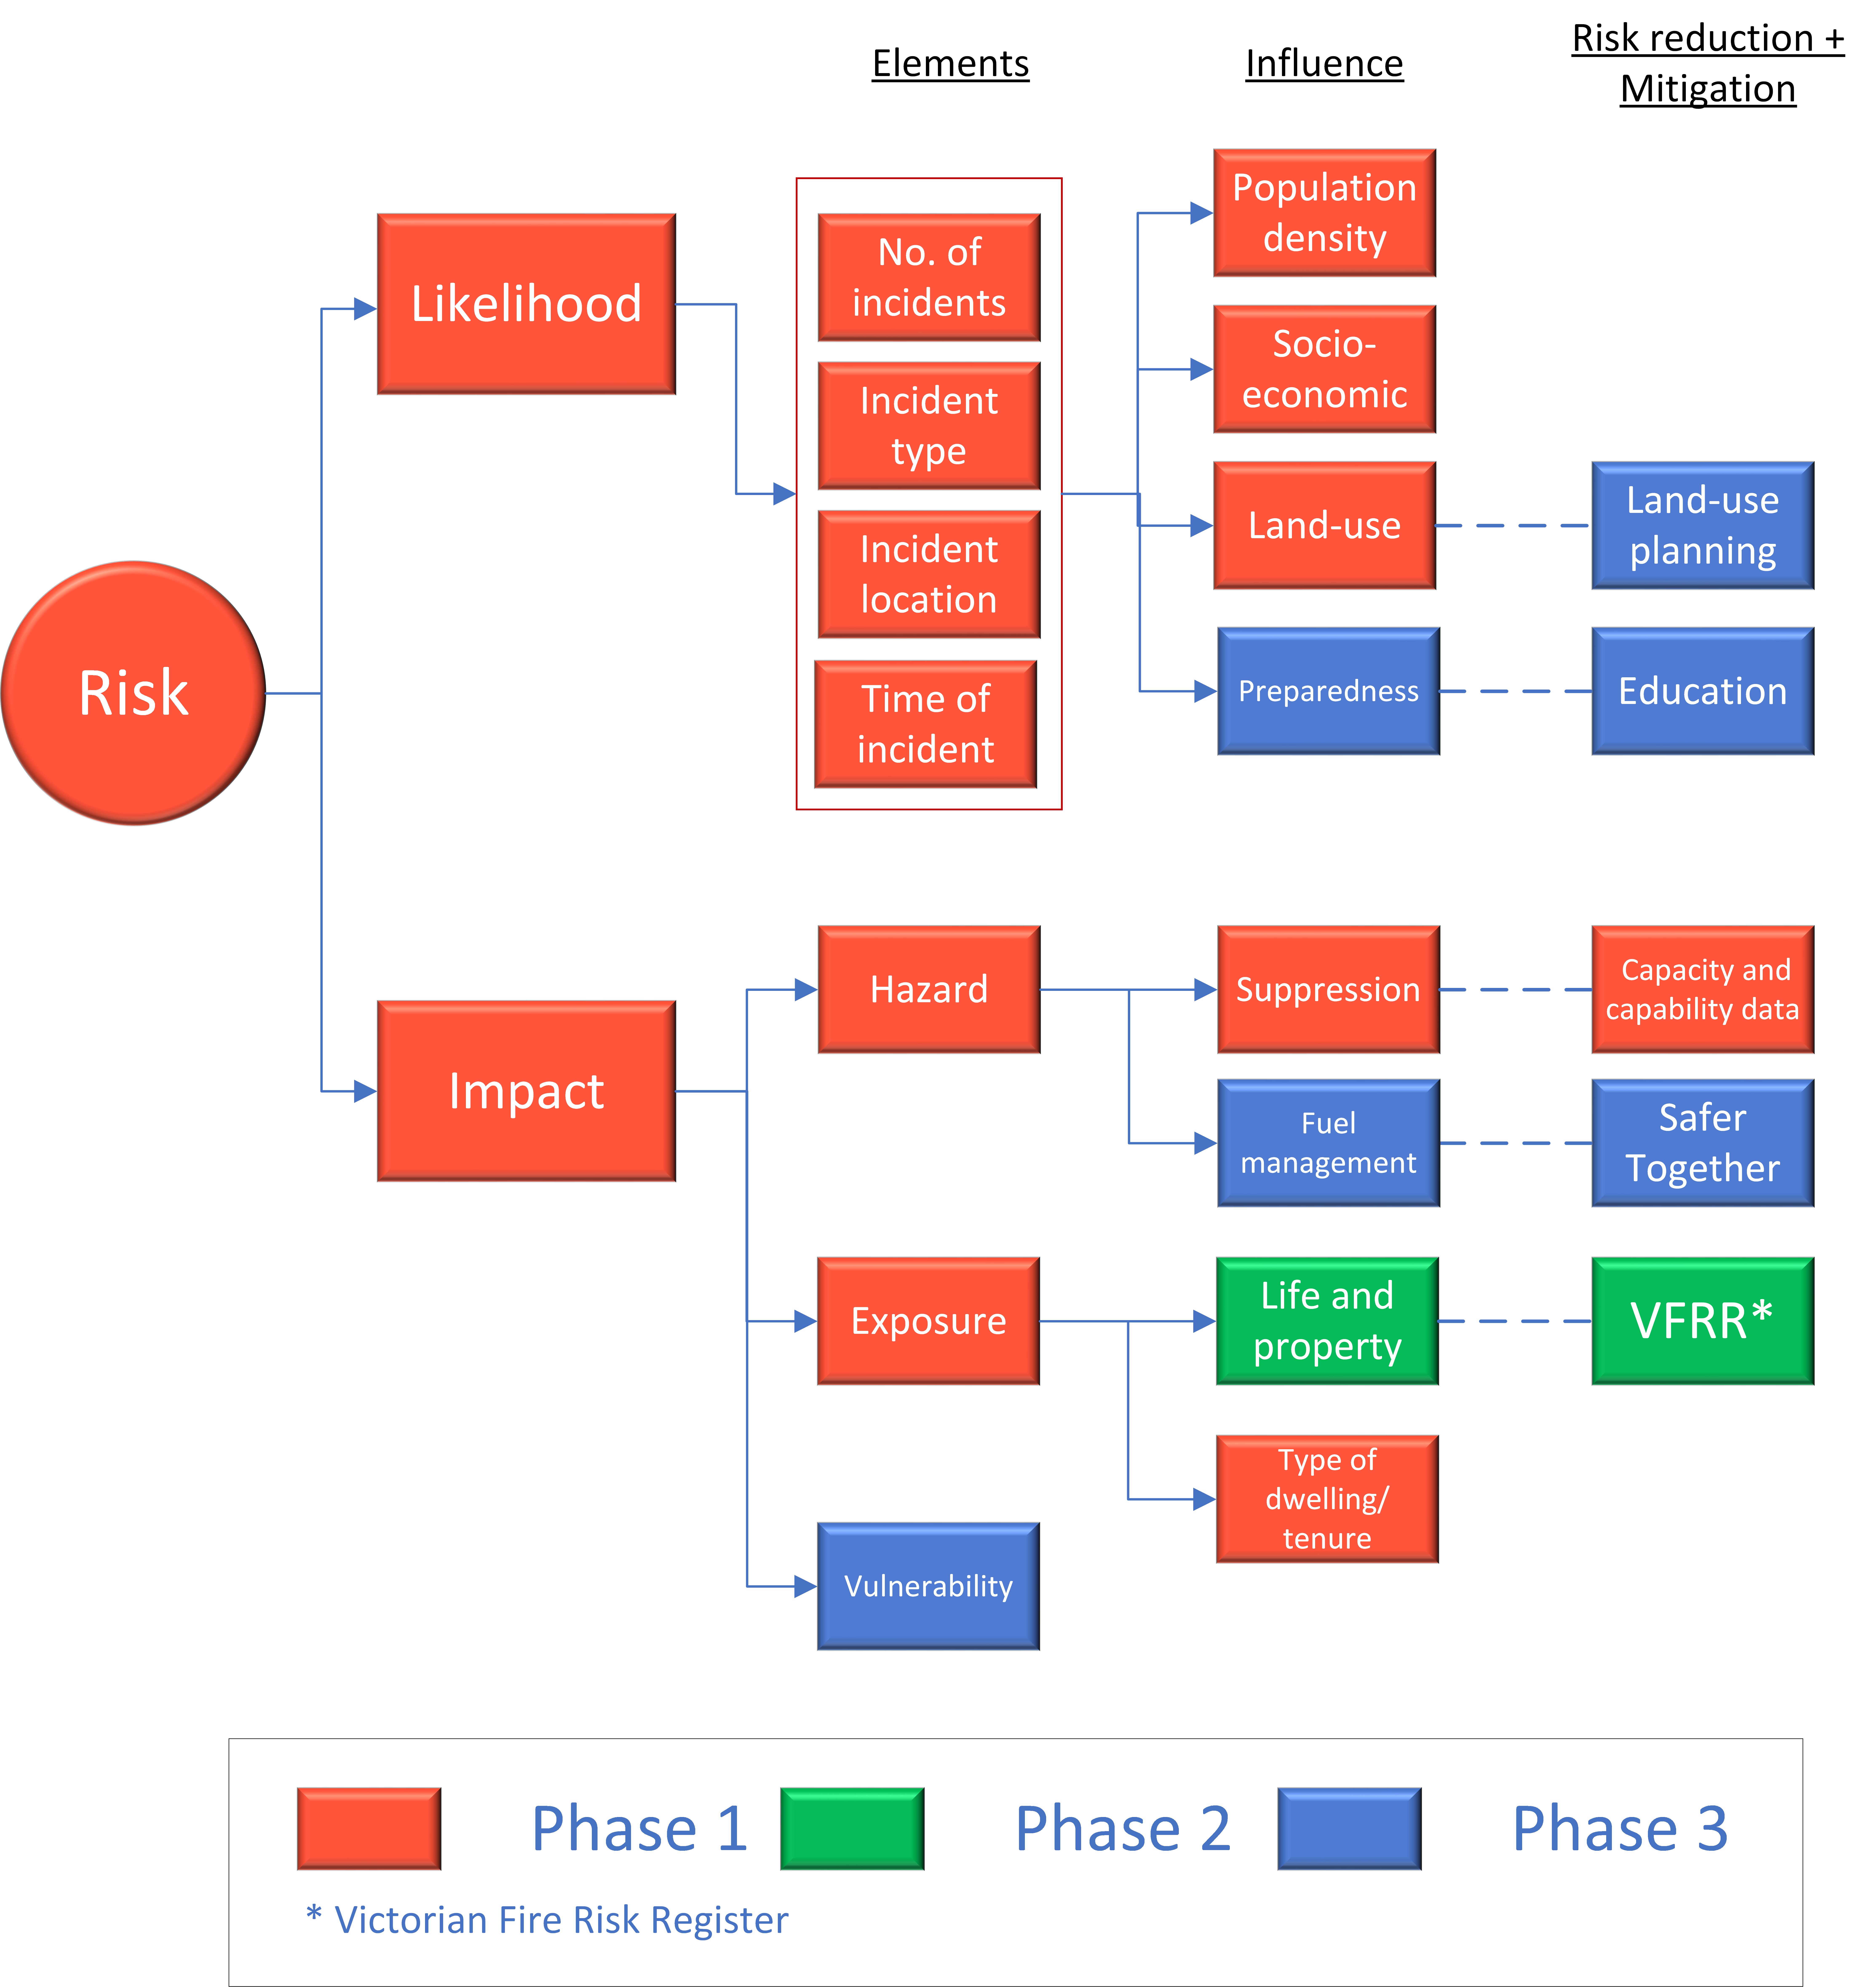
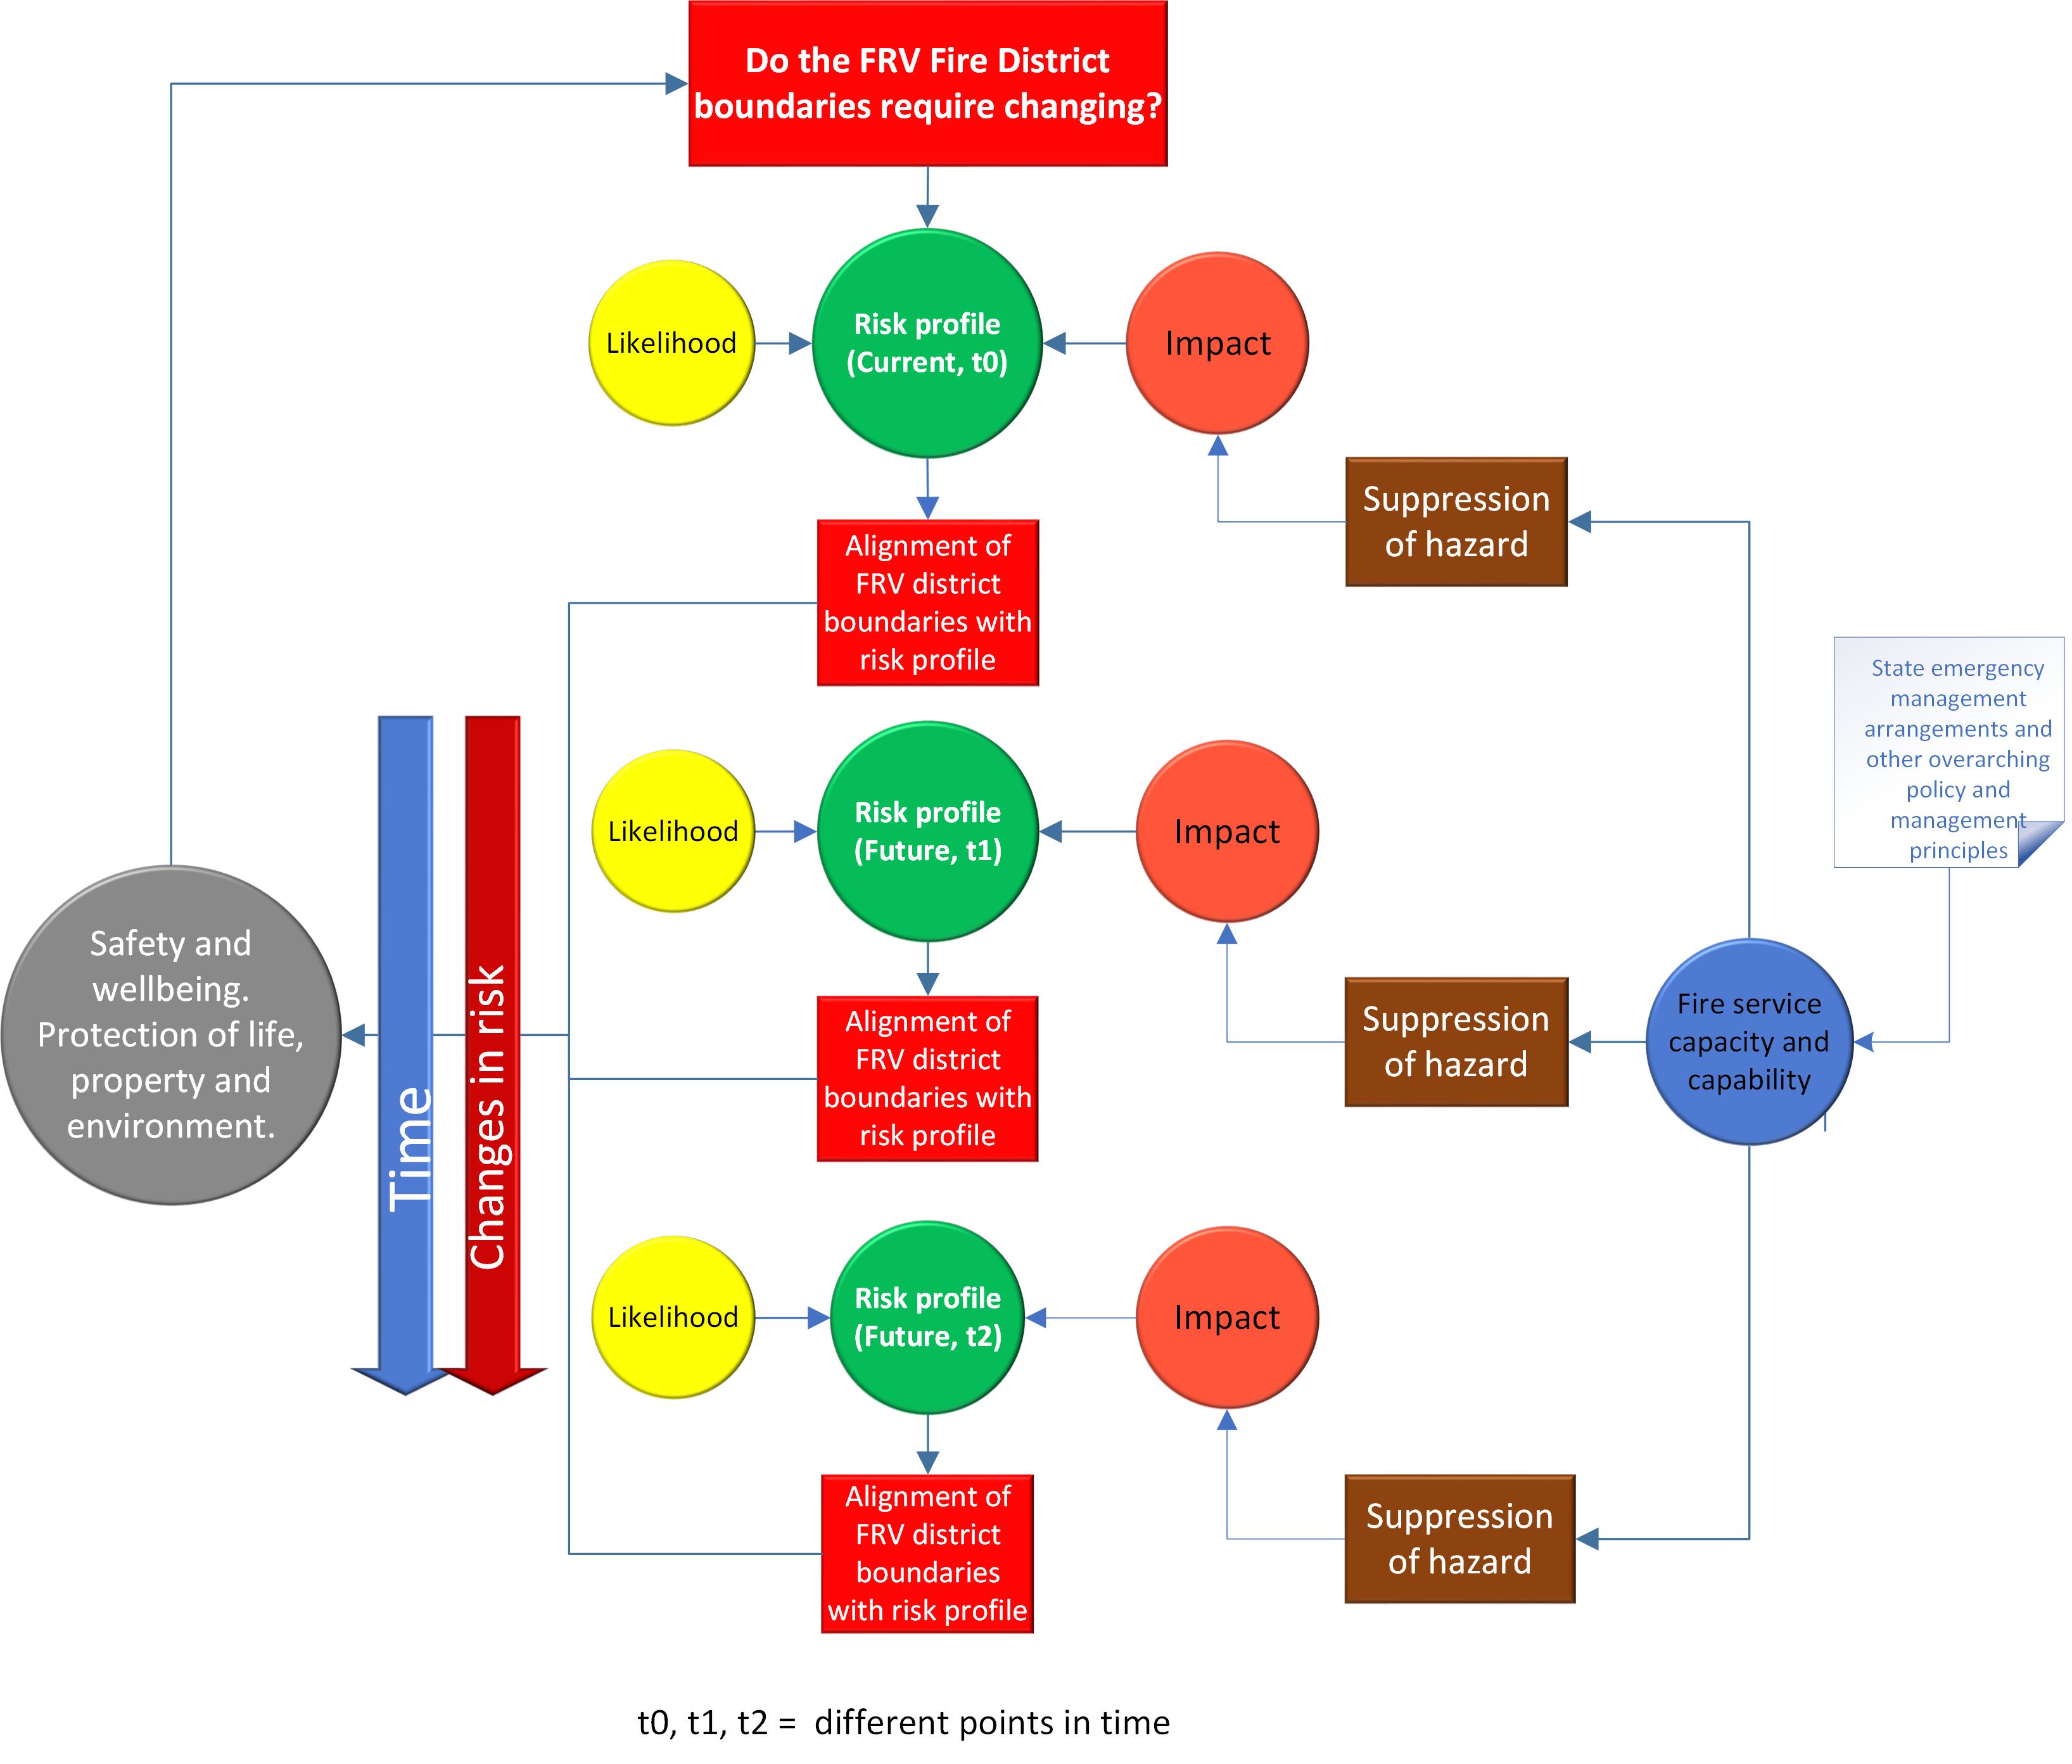
Figure B.1: The role of risk and its derivatives in the changes to the FRV fire district boundaries

Figure B.2: Proposed method for the quantitative assessment of risk profiles, using historical FRV and CFA data

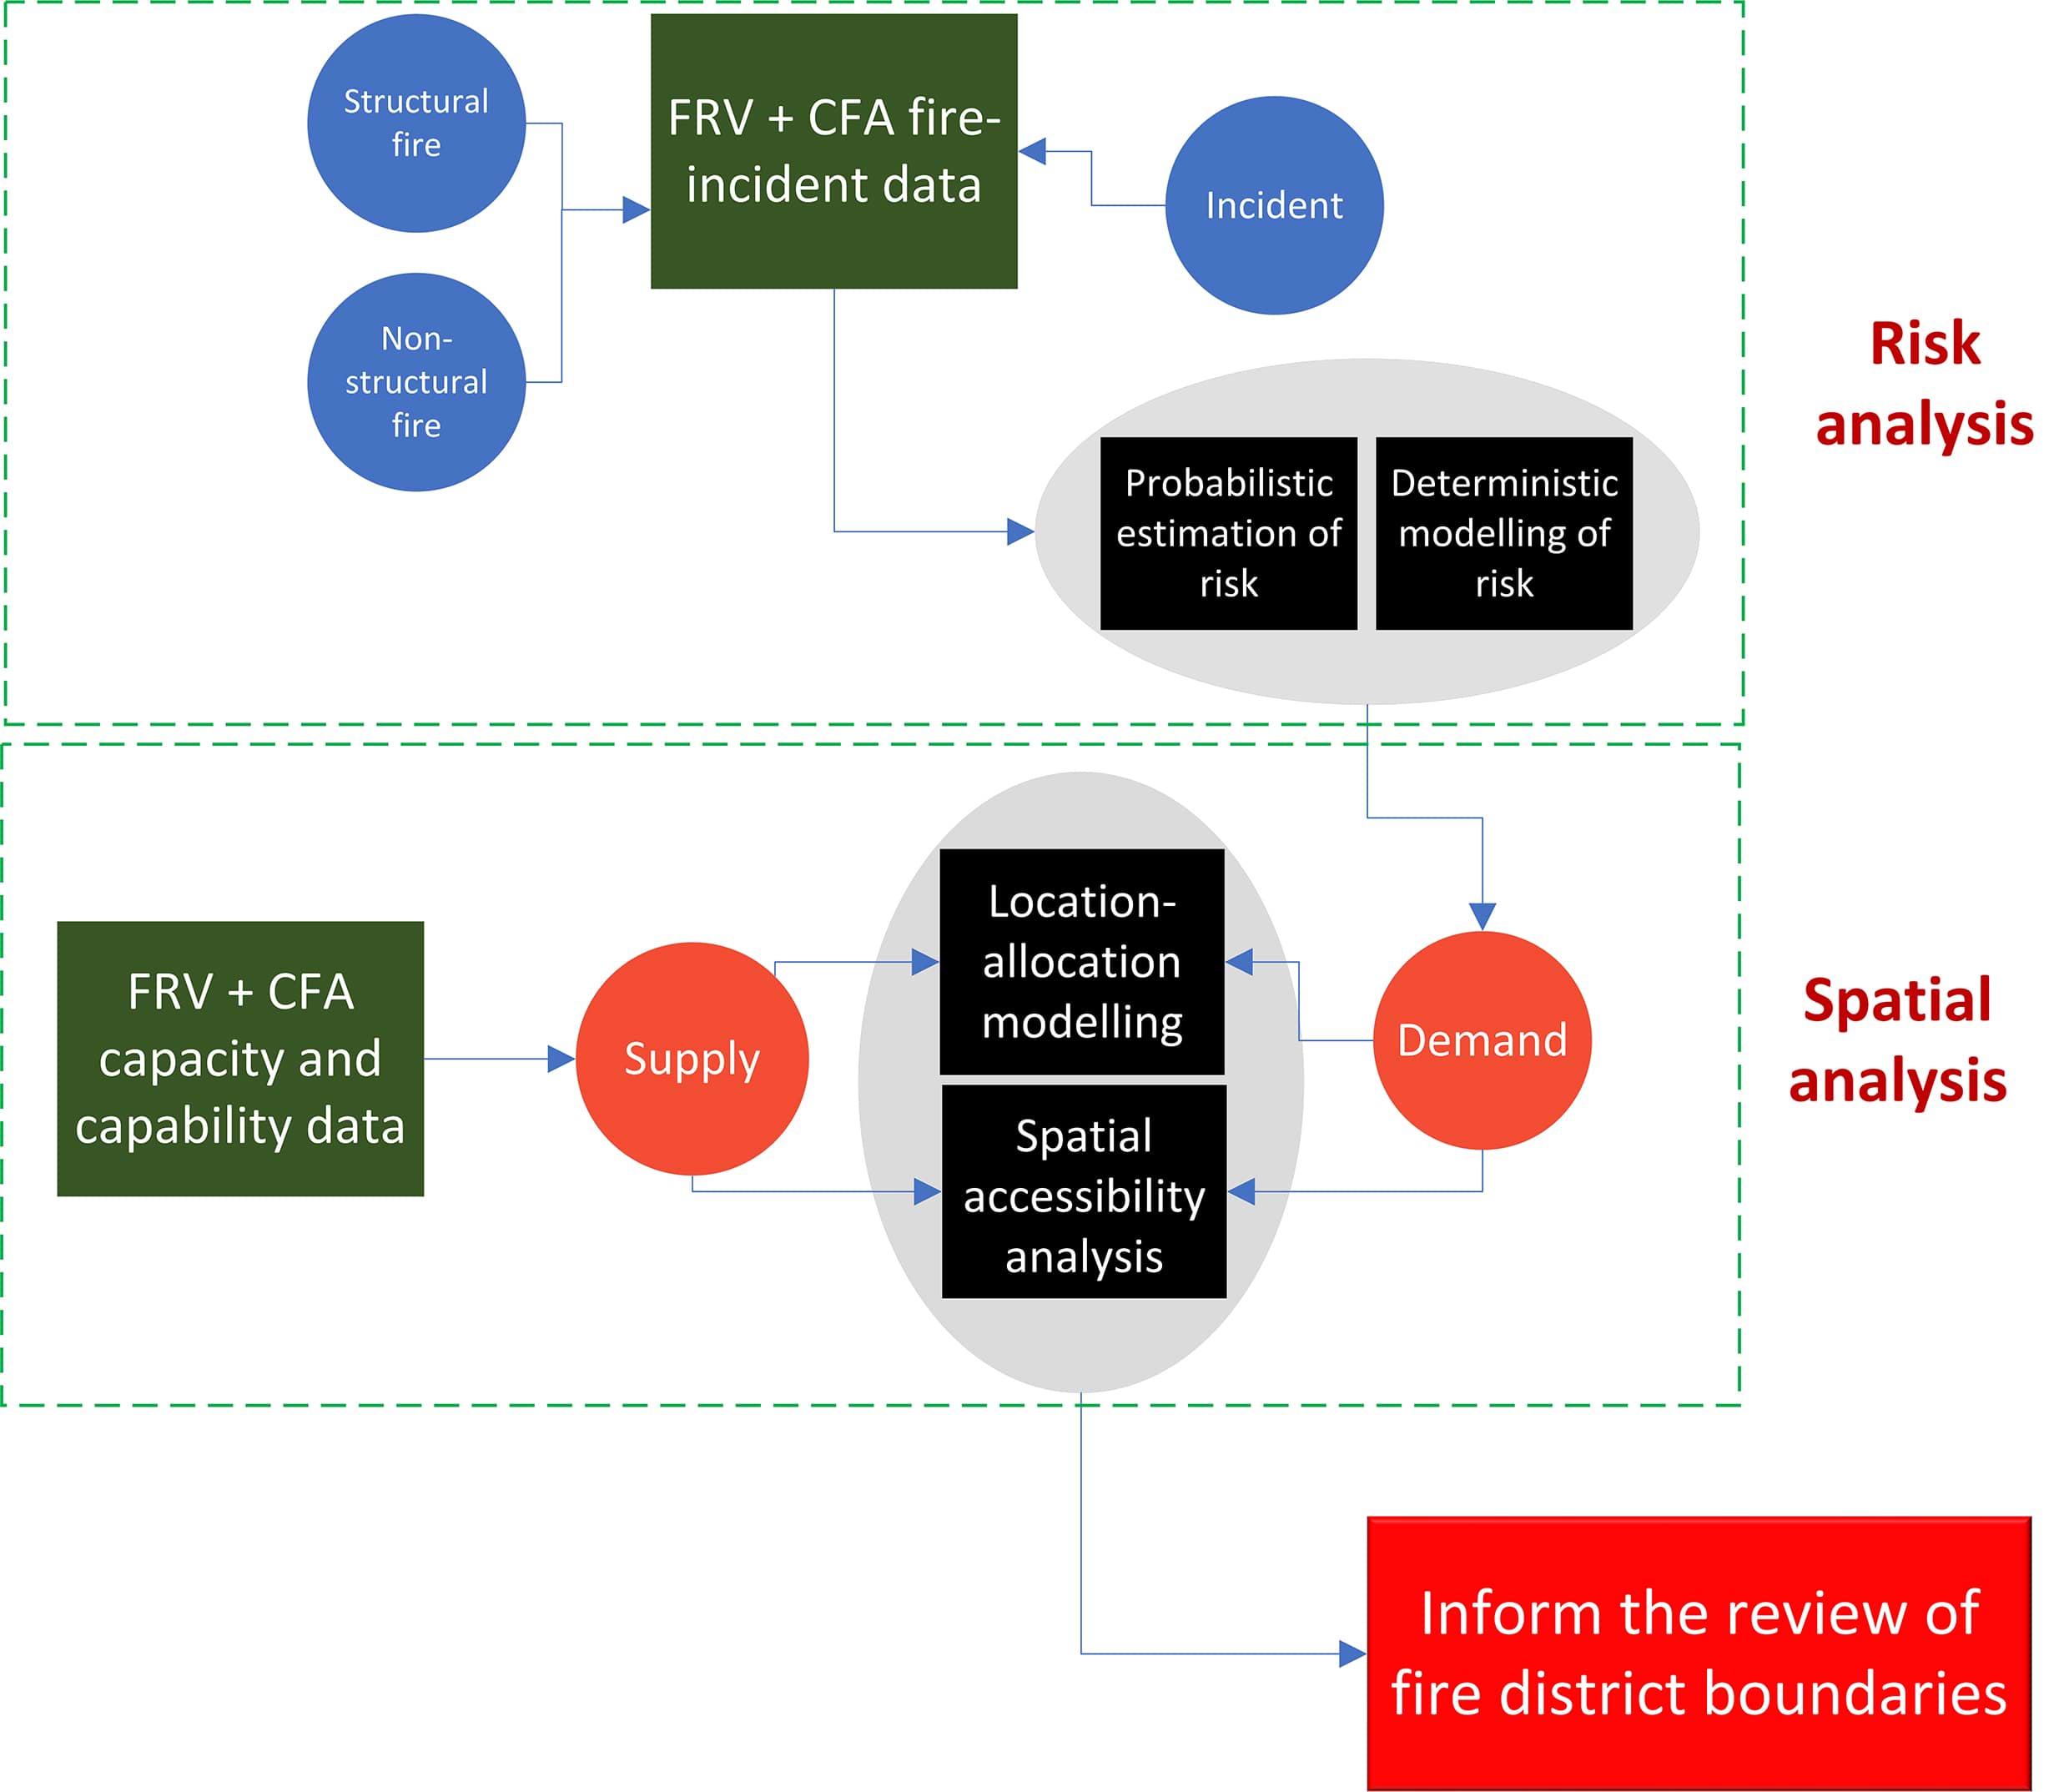
Figure B.3: Technical methodology for changes to the FRV fire district boundaries

Updated