An effort was made to recruit people from all disability settings and across Victoria.
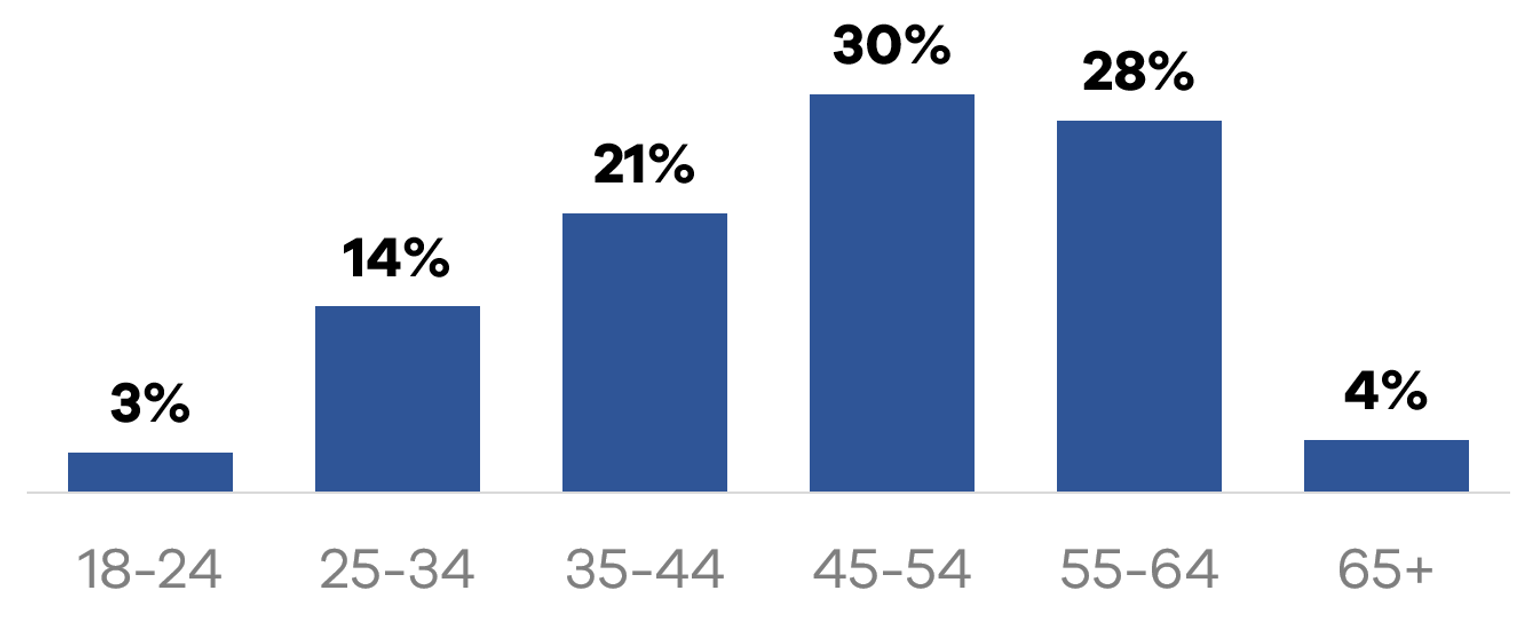
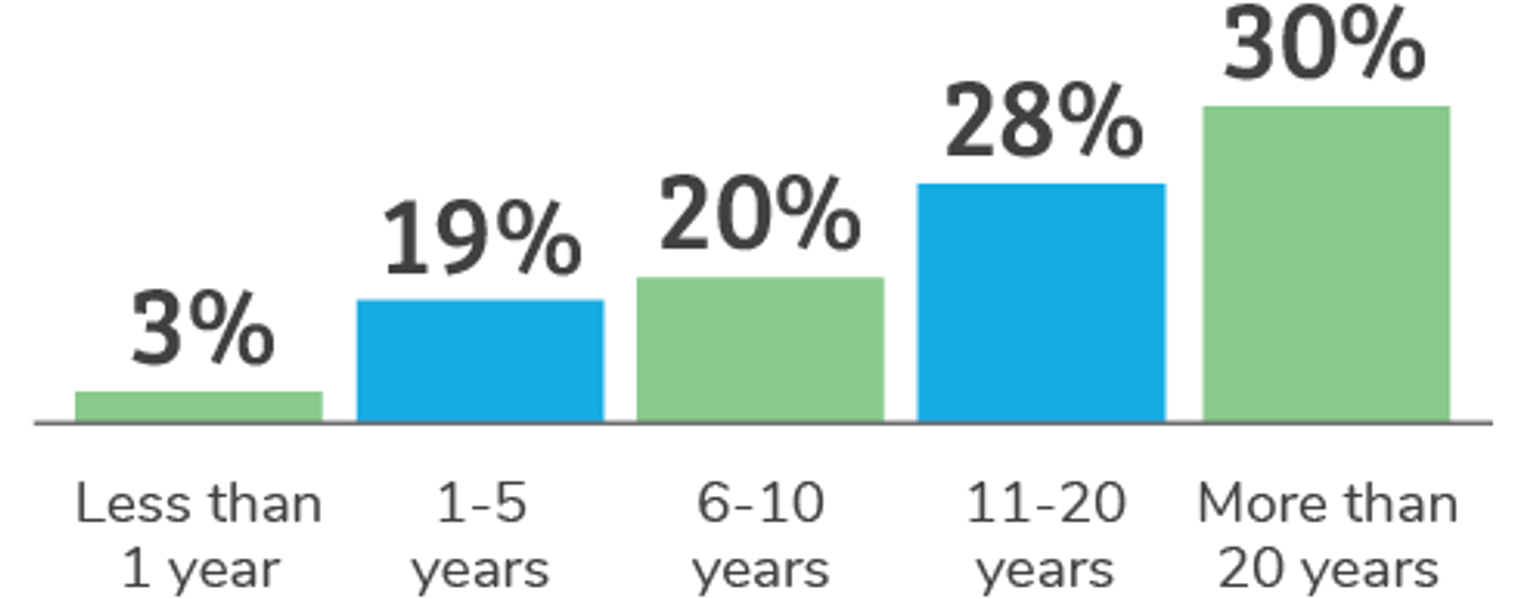
Survey participants were most commonly aged 45-54, located in metropolitan Victoria and had worked in the sector for over 20 years.
They were most commonly employed full time, worked in the public sector and were working in a region that was rolled out under the NDIS.
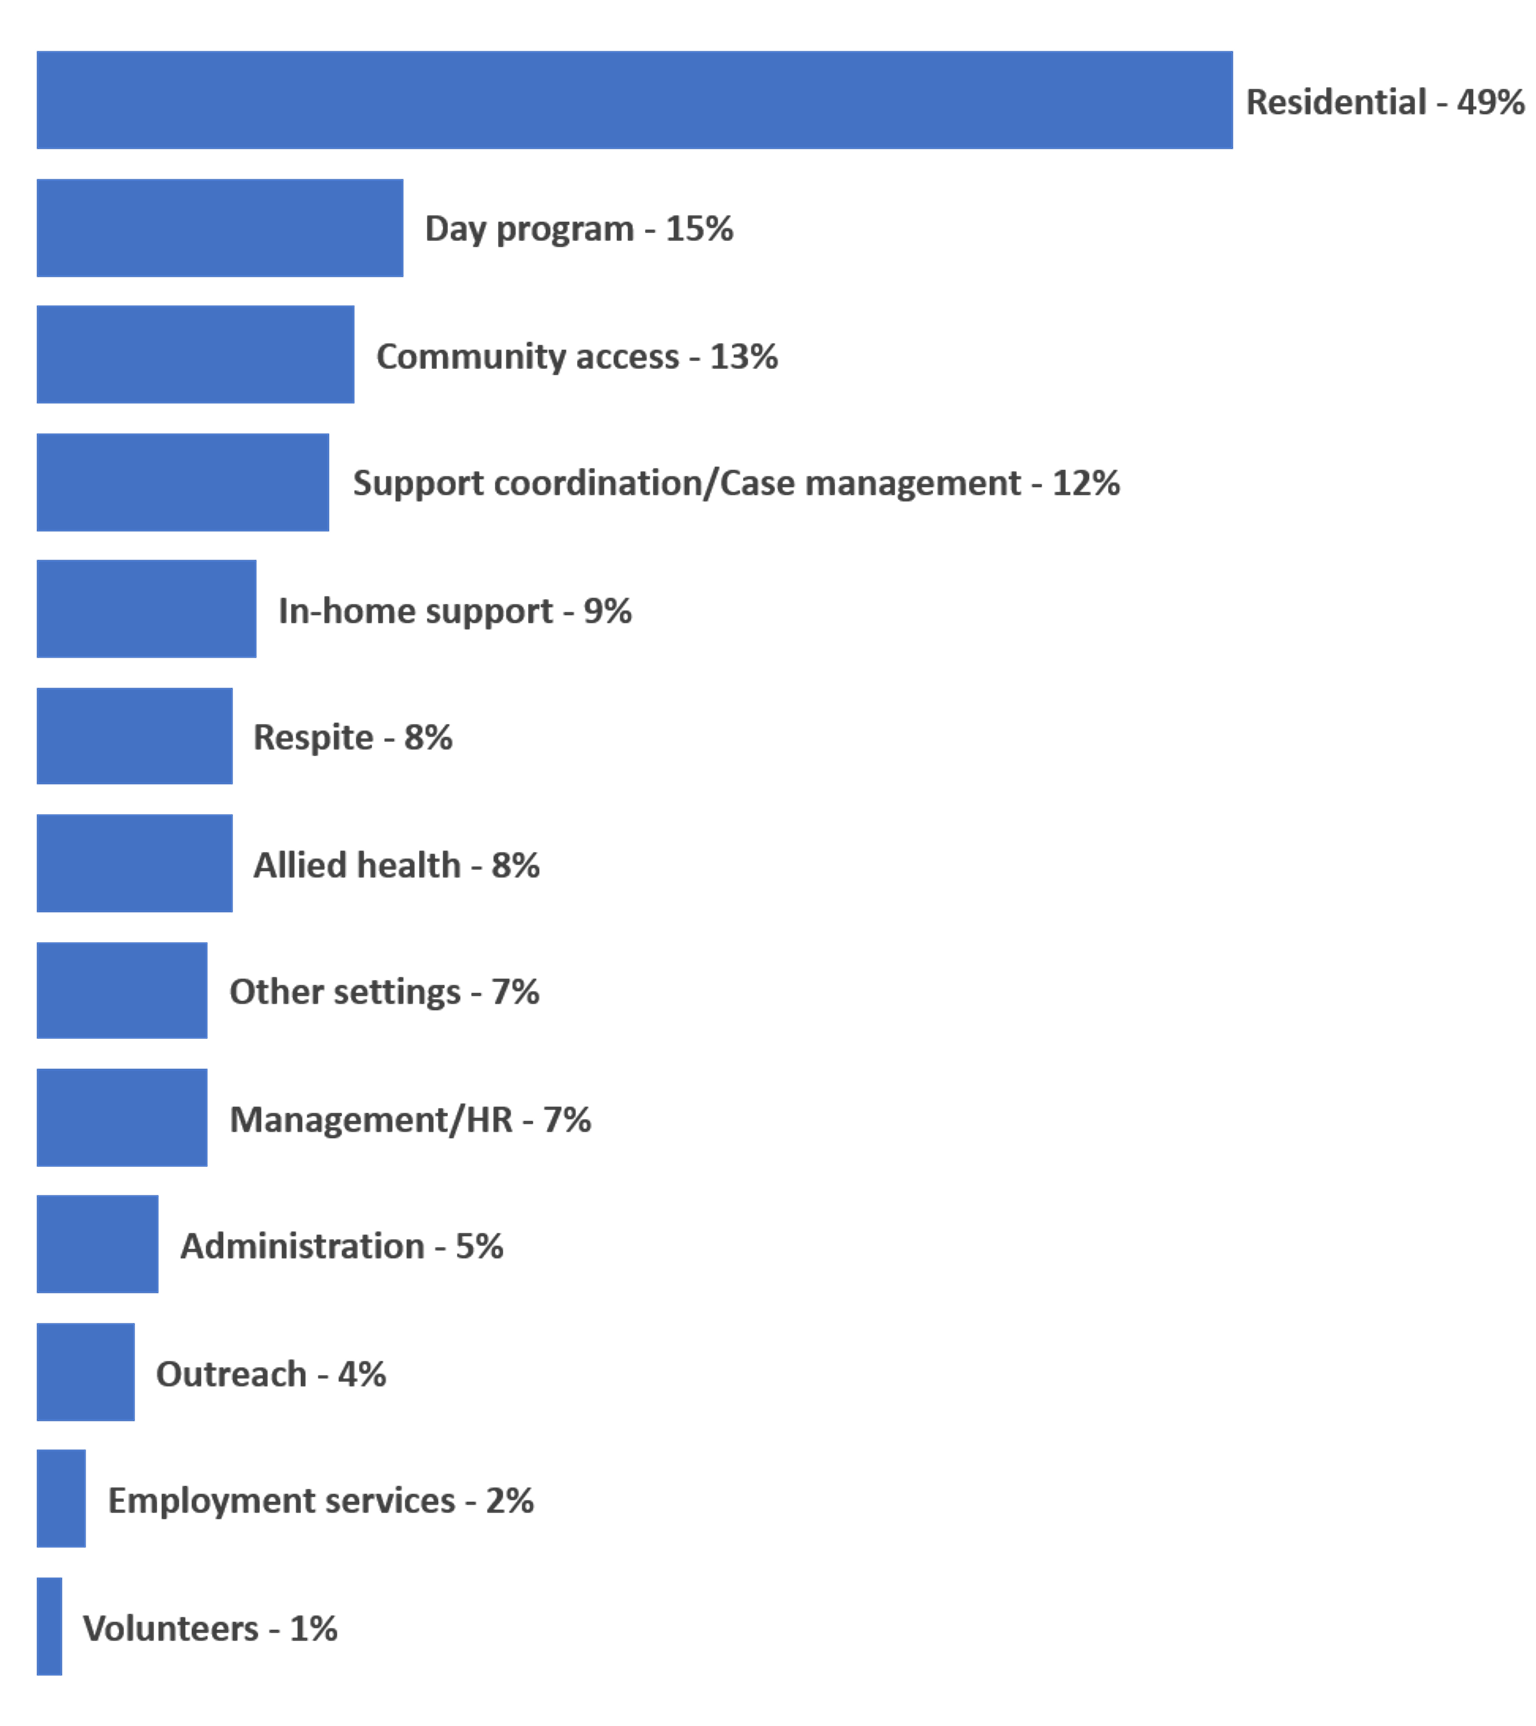
Almost half worked in a residential setting, and over half were members of the Health and Community Services Union. The characteristics of participants reflects the fact that the survey was advertised through the networks of the Expert Advisory Group. In future years, further strategies will be used to encourage a more diverse range of workers to participate. The characteristics of survey participants are outlined overleaf.
The demographic breakdown of the respondents taking part in the research included:
Gender
- 73% of respondents undertaking the research were female
- 26% of respondents were male
Location
- 64% of respondents worked/lived in metropolitan locations
- 37% were in regional locations
Indigenous status
- 1% of respondents identified themselves as Aboriginal or Torres Strait Islander
Employment status
- 84% of respondents said that they had worked for a single employer/organisation
- 13% had worked for multiple employers/organisations
- 3% said they were self-employed, directly employed by their client/s or a freelancer
Form of employment
- 45% of respondents had a permanent full-time job with paid leave entitlements
- 38% had a permanent part-time job with paid leave entitlements
- 4% had a fixed-term contract with paid leave entitlements
- 13% had a casual job without paid leave entitlements
Sector
- 40% of respondents worked for a not for profit or charitable organisation
- 5% worked in a privately owned, for profit organisation
- 55% worked for a public, government, or government owned organisation
NDIS Rollout status
- 17% had not rolled out yet
- 42% were in the middle of the NDIS roll out
- 41% were rolled out fully
Union membership
- 55% of respondents were members of the Health and Community Services Union
- 14% were members of another union
- 32% were not members of a union
Updated


