- Date:
- 22 Aug 2022
Executive summary
The Victorian Skills Plan identifies priorities and actions required to build a robust skills base for Victoria and fuel its economic recovery. These priorities and actions are informed by extensive evidence on the state of the Victorian economy and the challenges and opportunities that lay ahead.
Victoria’s economy is rebounding and is expected to experience strong workforce demand to 2025, with over 370,000 additional workers forecast to be needed. Demand is anticipated across all industries with aged and disabled carers, registered nurses and software and applications programmers most in demand. Despite an optimistic economic outlook, workforce constraints are a major challenge, especially in regional areas. Further, the pandemic is compounding this challenge.
Greater participation and higher productivity are required to address workforce constraints and secure Victoria’s future prosperity.
Key statistics
The Victorian economy is growing
- The Victorian labour market comprises around 3.5 million people, an increase of nearly 700,000 in the last decade.
- An estimated 373,000 additional workers are forecast to be needed in the next 3 years to meet demand from new jobs and replace retiring workers by 2025, including 82,400 in regional Victoria.
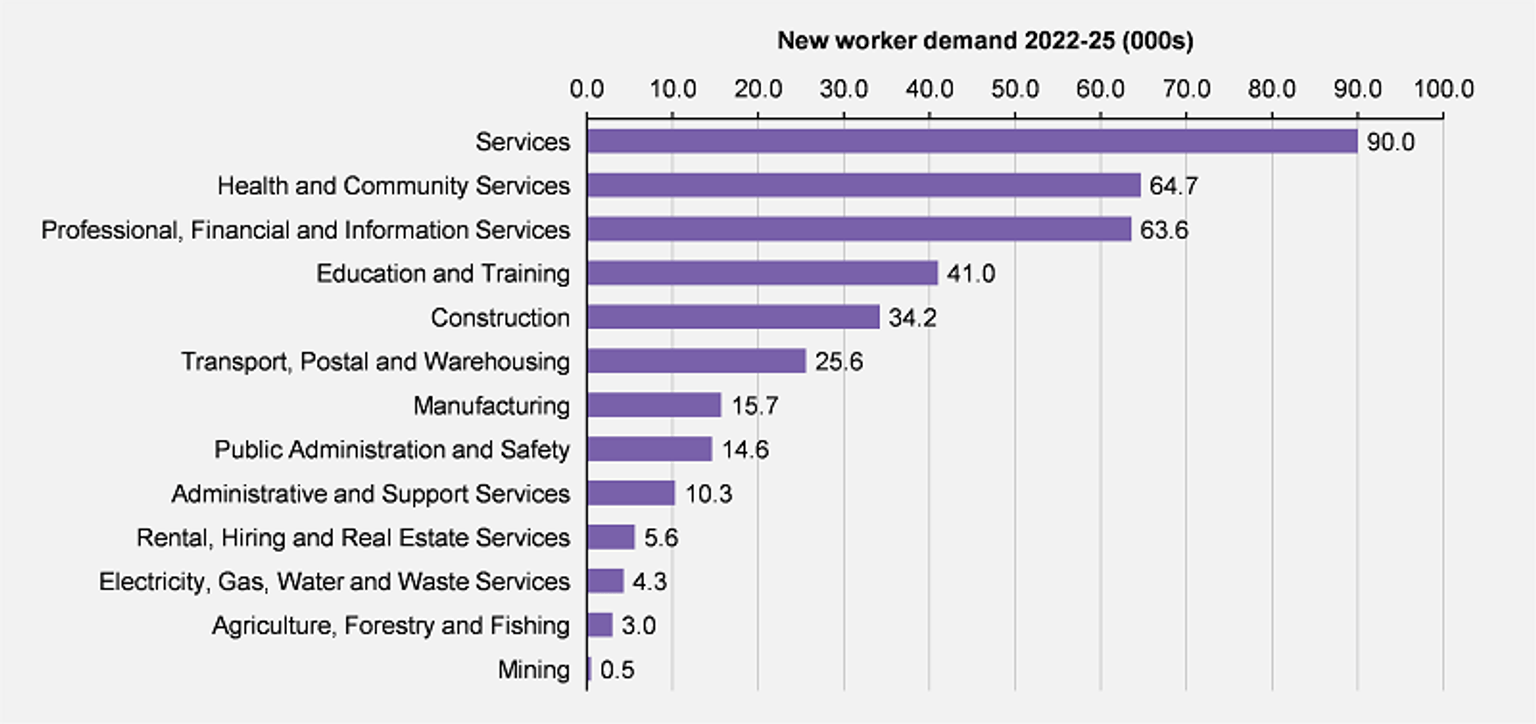
- Highest expected demand for additional workers is in services (90,000), health and community services (64,700), and professional, financial and information services (63,600).
Workforce supply is constrained by multiple factors
- Prior to the pandemic, Victoria averaged nearly 88,000 net arrivals from overseas per year. During 2021, Victoria experienced net departures of approximately 56,000.
- In 2021, 18,000 more people left Victoria than arrived from other states and territories, compared to net arrivals of 47,000 across the previous four years. Some areas in regional Victoria benefitted from internal migration.
- In early 2022, employers reported that both now and throughout recent lockdown periods, between 10% and 20% cent of their workforce were unable to work due to contracting the virus or needing to care for loved ones with COVID-19.
- The number of workers who in the last 3 months to-date left their job for a better one or for change is 45% above pre-pandemic levels.
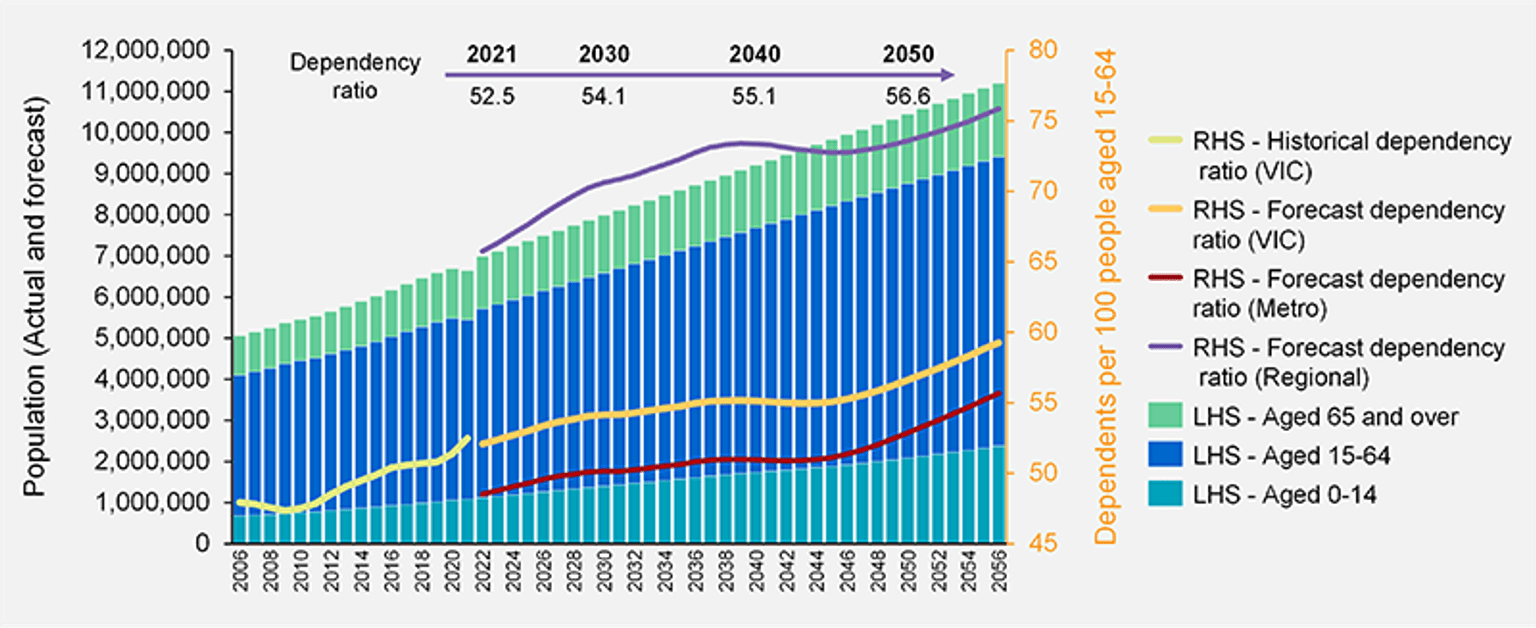
- In 2021, the number of non-working age people relative to working aged people was 52.5 per 100. Due to the ageing population this is expected to increase to 56.6 in 2050 and from 65.7 to 73.6 in regional areas.
Shortages are present and likely to become more acute
- As of February 2022, there were more than 72,000 vacancies, a level not seen since 2008. Similarly, unemployment around 4% is at levels not observed in more than 40 years.
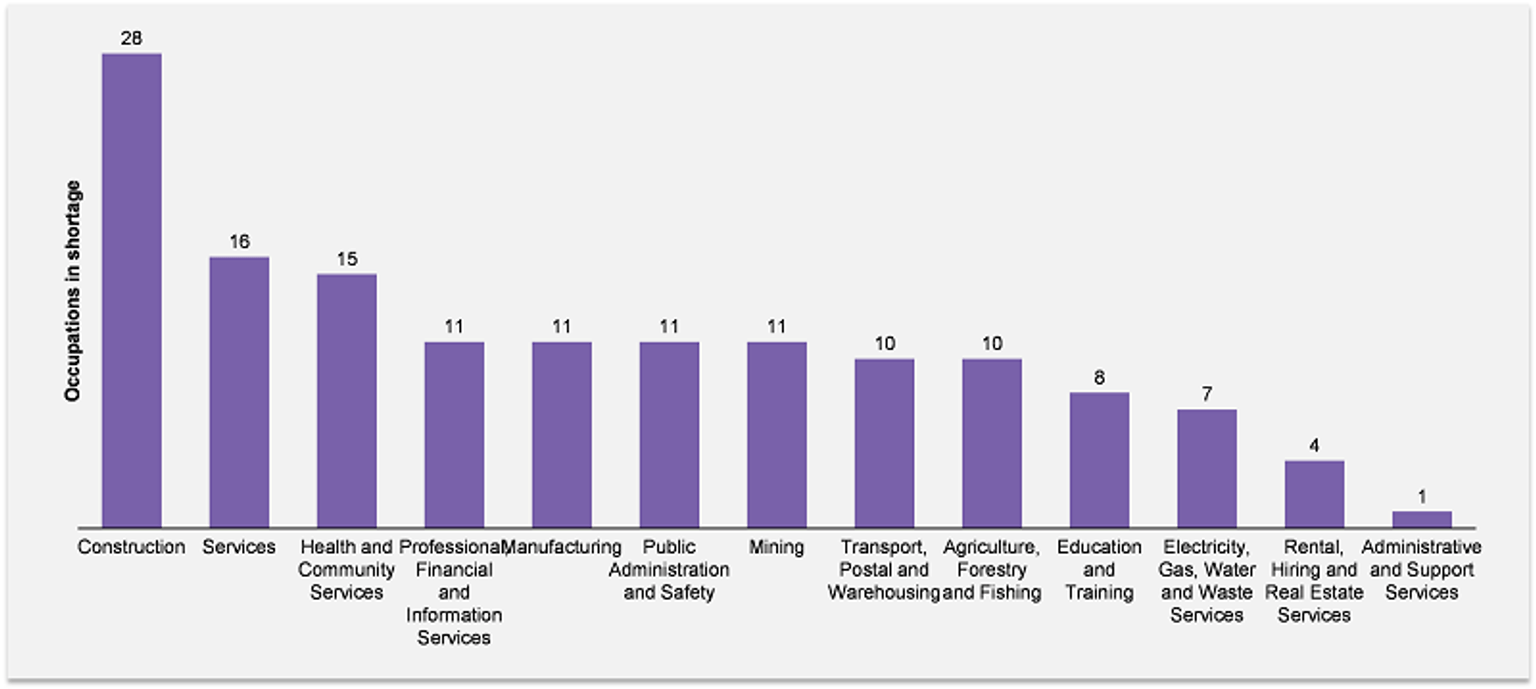
- A total of 143 different occupations were identified as in shortage, with most shortages occurring in construction (28) services (16) and health and community services (15).
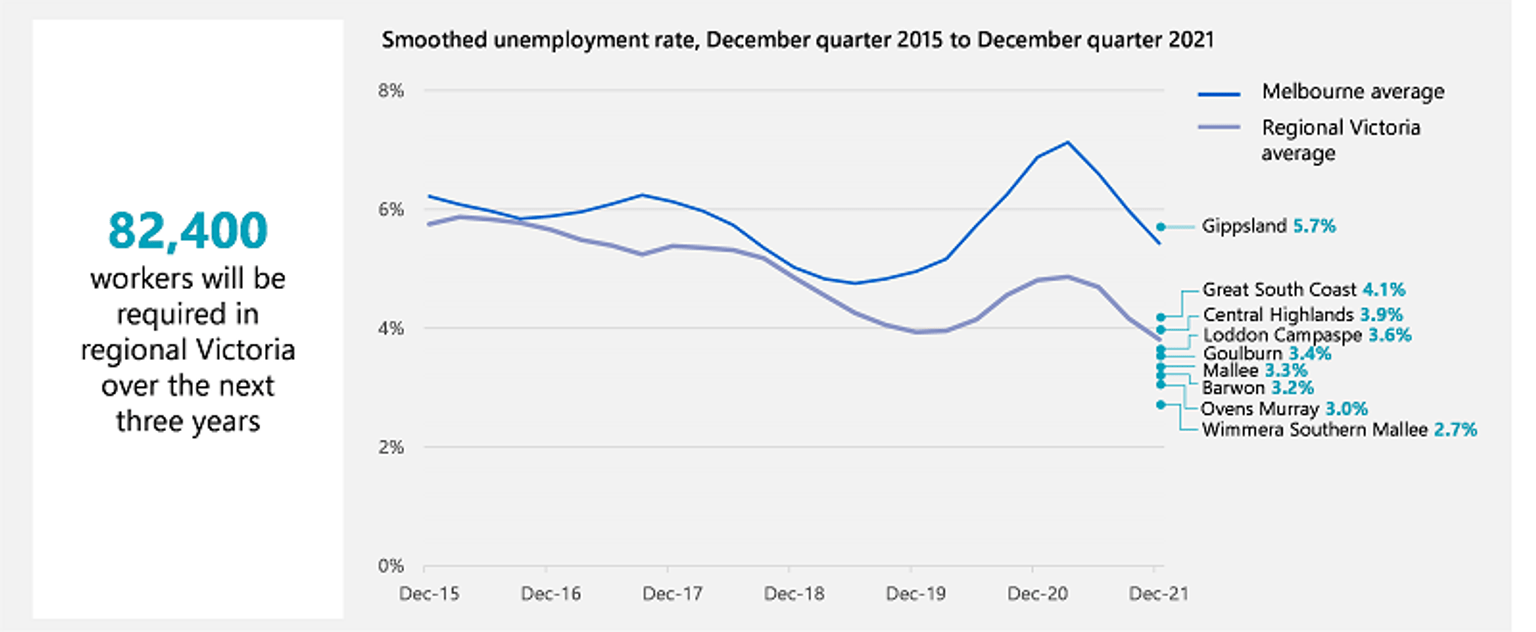
- Eight out of 9 Victorian regions had an unemployment rate below metropolitan Melbourne as of December 2021.
Participation and productivity can drive future prosperity
- Participation has lifted from 63.0 to around 67% cent since 1992. Female participation has risen from 52.6% to around 62% and Male participation declined from 73.7% to around 72%.
- In February 2022, there were an estimated 1.75 million people not in the labour force, with 876,000 permanently not intending or unable to work. Of the remaining 899,000, an estimated 195,600 wanted to work, are available within 4 weeks to take up work, but are not actively looking.
- In February 2022, 222,600 people were underemployed, and these workers indicated a preference to work an additional 3,031,700 hours. This is equivalent to almost 7,000 full-time jobs.
- Of employers surveyed recently, 83.8% indicated they believe they have the skills they need in their workforce to function now while only 79.2% believe they have the skills for the next 12 months.
- Of the same employers surveyed, 60.6% indicated they supported staff training in the past 12 months, either by paying for the training or providing staff with the time off to engage in the learning.
- National productivity performance has increased over the decades and Australia sits in the middle of OECD rankings1. Since 2013, Victoria’s Gross State Product (GSP) per capita has been below the Australian average.
Data note*
References
1 Australian Government Productivity Commission, PC Productivity Insights, March 2022.
* Industries are based on the Australian and New Zealand Standard Industrial Classification (ANZSIC).
In this publication, some industries have been amalgamated as follows:
- service sector includes: accommodation and food services, arts and recreation, retail, other services and wholesale trade.
- professional, financial and information services includes: financial and insurance services, information, media and telecommunications and professional, scientific and technical Services.
Note that data is correct and reported as of May 2022. Later releases of data will be incorporated into future updates of the Victorian Skills Plan.
The Victorian economy is growing
Victoria’s economy is growing and rebounding strongly from the pandemic, creating opportunities for skilled workers across all industries, regions and occupations. Demand is being driven by existing vacancies, new jobs and replacing retiring workers. Collectively, 373,000 new workers are forecast to be needed in Victoria by 2025.
Victoria’s economy is large and diverse
The Victorian labour market comprises around 3.5 million people – an increase of more than 700,000 in the last decade. Over this period, unemployment has reduced from 5.5% to rates around 4% and participation has grown from 64.8% to around 67%.
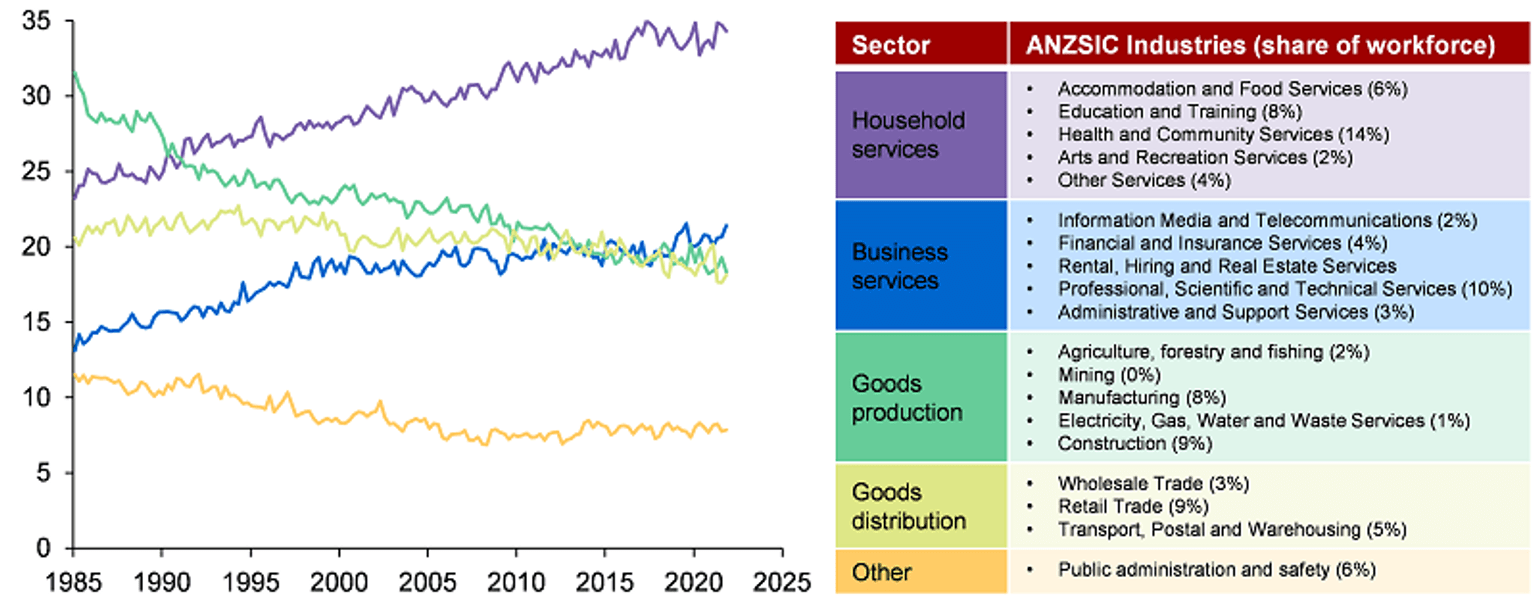
The largest sectors by employment are concentrated in industries that mostly serve local households and businesses (refer Figure 1). Construction, manufacturing, wholesale trade and public administration are also large sources of employment. Health and community services, professional services and retail are the largest industries by employment.
Regional communities make an important contribution to Victoria’s economy, accounting for over a fifth of the State’s total workforce. This workforce underpins the state’s performance in primary industries, providing the resources, food and fibre to sustain our populations, and contributing high-value exports through manufacturing and transport hubs. Regional landmarks draw domestic and international visitors to Victoria, supported by a strong visitor economy workforce. A growing proportion of the regional workforce is focused on providing the services and infrastructure that are critical to serve our regional communities, which are primed for strong growth following the pandemic.
373,000 new workers are needed in Victoria by 2025
An estimated 373,000 additional workers are forecast to be needed by 20253 to meet demand from new jobs and replace retiring workers, with 82,400 needed to meet regional workforce demands (including replacing retirements and new jobs created).
While all industries have sectors with forecast growth, those driven by changes in population such as health and community services face significant growth with an estimated 64,700 workers needed. Food and accommodation, retail, wholesale trade and arts and recreation services and other services forecast an additional 89,000 workers and education and training will see demand grow by 41,000 workers by 2025 (refer Figure 2). Further information on employment growth is provided in Appendix 1.
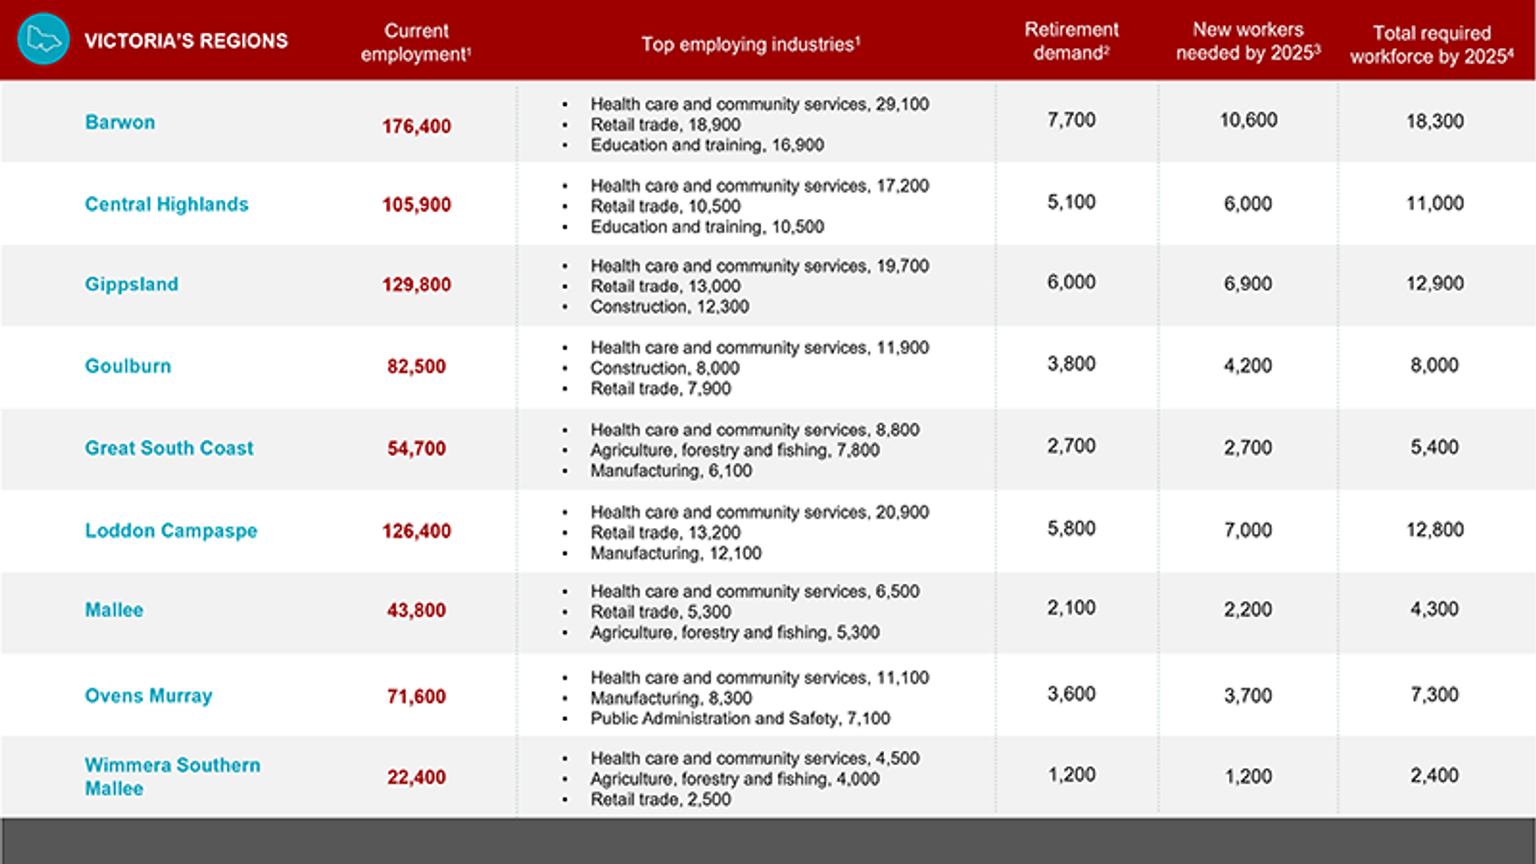
Employment growth is forecast across regional Victoria with concentrations in certain select industries. Approximately 74% of Victoria’s agriculture, forestry and fishing, 44% of mining, 26% of administrative and support services and 26% of construction industry workforces are based in regional Victoria. Substantial employment occurs in all other industries, including manufacturing hubs in Wodonga, Kerang, Portland or Bendigo. Tourism along the Surf Coast and Great Ocean Road or Victorian High Country; energy generation and transmission across Gippsland, Mallee and Great South Coast; and regional health care and community services and education and training are priorities. Further information on employment growth expected in Victoria’s regions is available in Appendix 2.
Occupations are in demand across all Victorian industries
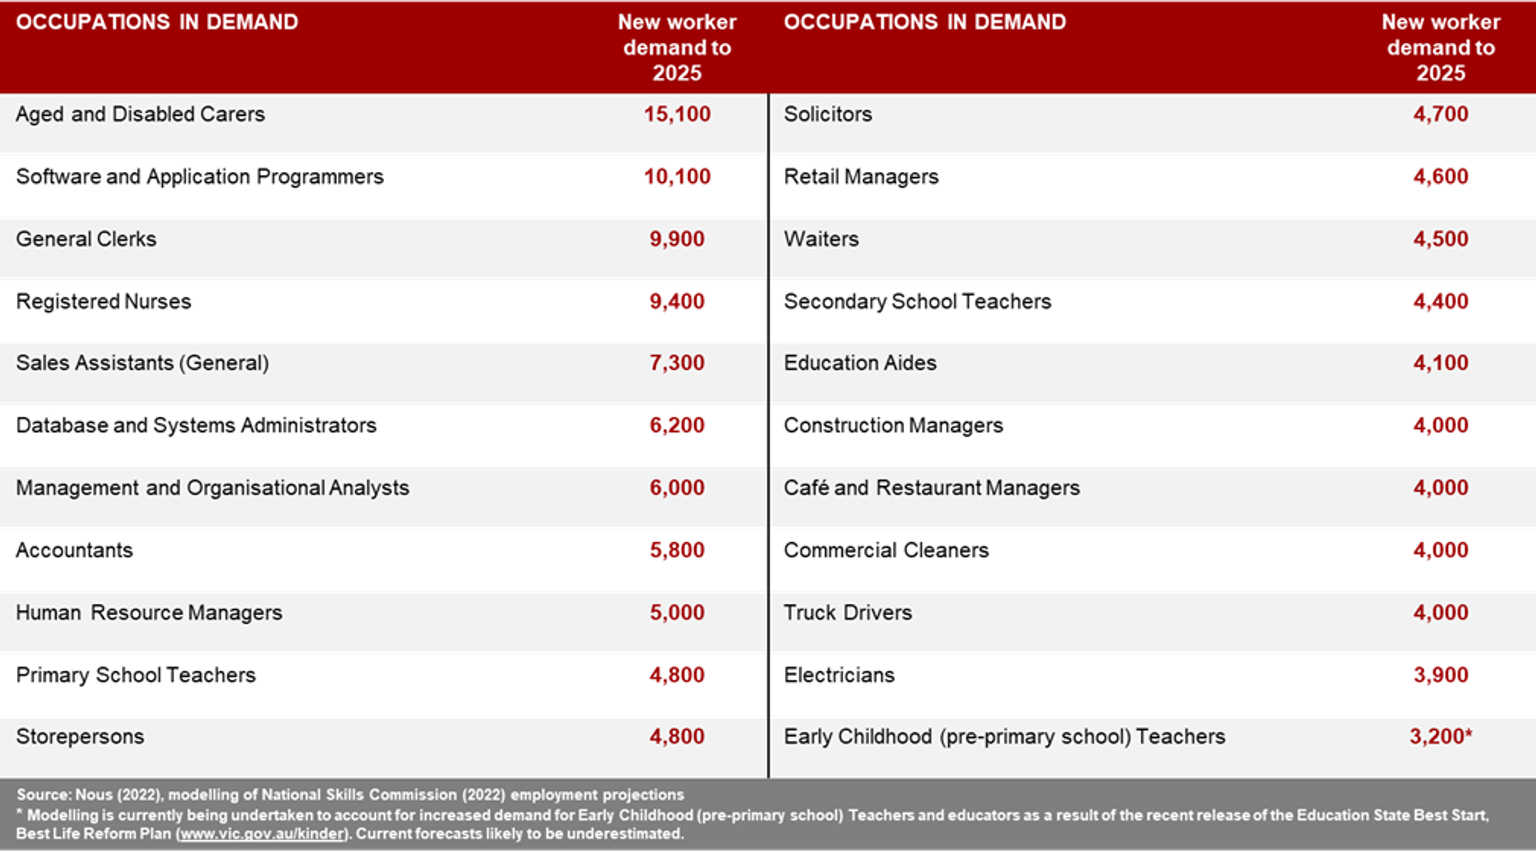
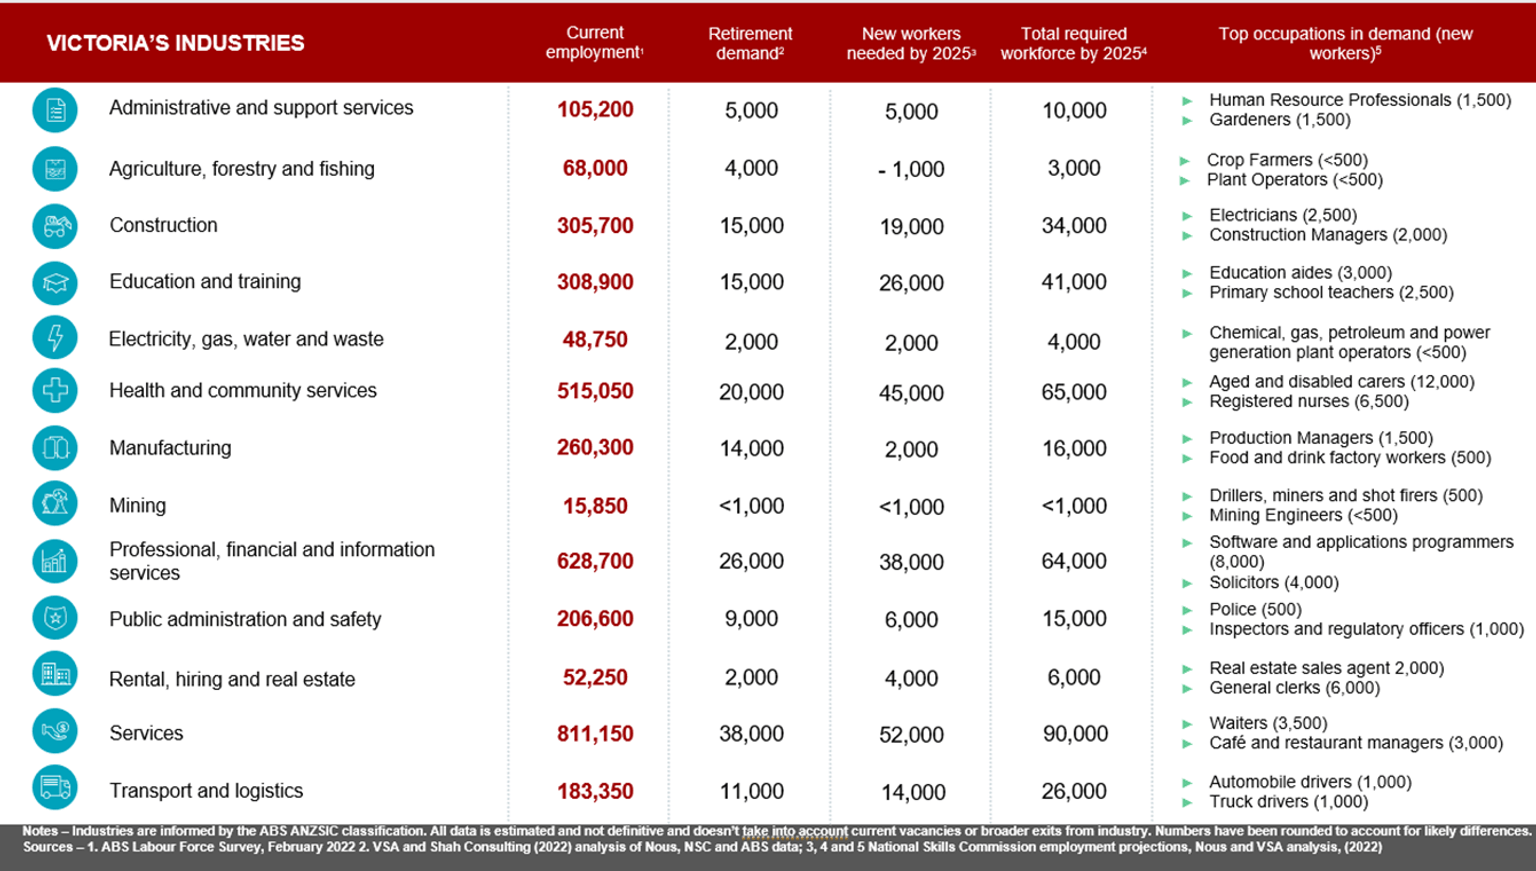
Employers in all industries are looking for workers in key occupations (refer Figure 3 for a cross section of occupations from the Victorian economy). These ‘occupations in demand’ show the total number of new workers needed by 2025 accounting for anticipated growth in new jobs and those needed to replace retirees.
In demand occupations are distributed across every industry. High growth industries are experiencing the largest demand, for example, in the services industry there are 151 occupations such as waiters, sales assistants and café and restaurant managers with demand for 100 or more new workers by 2025. In professional, financial and information services there are 102 occupations with demand for 100 or more new workers (for example, software and applications programmers, solicitors, and accountants) and in health and community services there are 70 occupations (for example, aged and disabled carers, registered nurses and nursing support and personal care workers).
There are also occupations that are critical for the functioning of industries and regions but require fewer workers (such as saw technicians, metal casters and harbor pilots). While critical, the small numbers of workers in these occupations makes it challenging for training to be available or financially sustainable for providers to deliver. This can impact the viability of some industries and jobs in the local communities that rely on them.
*Modelling is currently being undertaken to account for increased demand for early childhood (pre-primary school) teachers and educators as a result of the recent release of the Education State Best Start, Best Life Reform Plan (www.vic.gov.au/kinder). Current forecasts likely to be underestimated.
References
2 Australian Bureau of Statistics 2022, Labour Force, Australia, Detailed, cat.no.6291.0.55.001, reference period March 2022, released April 2022, ABS, Canberra
3 Nous (2022), modelling of National Skills Commission (2022) Employment Projections 2022–2025
Workforce supply is constrained by multiple factors
The pandemic continues to affect workforce supply through its wide-ranging impacts, including on migration, workforce availability, labour mobility and work placements. Compounding the impacts is the lower proportion of people aged 15-64 who are available to meet the growing demand for workers.
The closure of international borders has restricted new arrivals
Prior to the pandemic, Victoria averaged nearly 88,000 net arrivals from overseas per year. During 2021 Victoria experienced net departures of approximately 56,000.4
Internal migration patterns are similar. In 2021, 18,000 more people left Victoria than arrived from other states and territories, compared to net arrivals of approximately 47,000 total across the previous 4 years.5
These factors contributed to Victoria’s population falling for the first time in almost 30 years. There were 160,000 fewer working age people in Victoria in 2021 compared to pre-pandemic forecasts – equivalent to around 2 years’ workforce growth under historical trends.6,7
There are several regional local government authorities, however, that had net internal migration growth over 2020–21, including Ballarat, Bass Coast, Baw Baw, Greater Bendigo, Greater Geelong, Mitchell and Surf Coast.
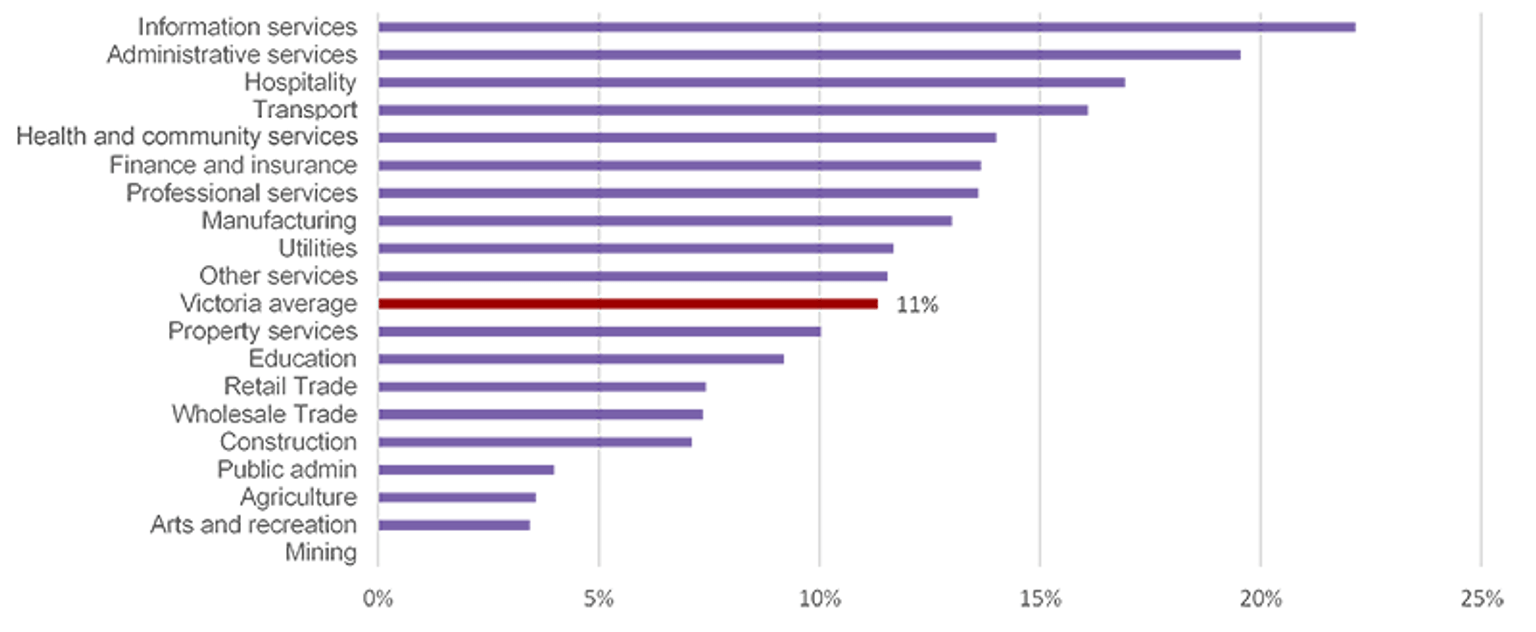
The impact on industries has varied, with those most reliant on overseas migration such as accommodation and food services and agriculture (primarily the seasonal workforce) more affected (refer Figure 4). All industry groups consulted for the Victorian Skills Plan identified migration as critical for meeting specialised skill needs.
The pandemic continues to disrupt workforce dynamics
The pandemic presents a once in a generation challenge. As infections increased, many employers reported between 10% to 20% of their workforce were unable to work8,9 or needing to care for others who had contracted COVID-19.
With the virus transitioning from pandemic to endemic10, absenteeism could remain a challenge for at least the next 12 to 18 months.
The rate of supply of new entrants to the workforce from students completing their studies has also been impacted and will continue to be by pandemic disruptions. Many students face barriers to securing work placements required to complete their qualification. Several health and community services qualifications require mandatory work placements, yet lockdowns and other restrictions made it difficult for worksites that typically take students to do so. There is a risk that these students will chose not to complete their qualification and will be lost from the industry.
Increasing movements of people within the labour market contribute to a dynamic economy, but can be unsettling for those employers who need to find replacements, especially on top of worker shortages. In 2021 there was record low job mobility11 with workers prioritising job security over risking a move to a new job, even though it may better suit their skills and education levels. Recent data shows mobility may be returning – the number of workers who left their job for a better job or change in the last 3 months to-date is 45% above pre-pandemic levels.12 In addition, the percentage of employed people who do not expect to be with their current employer or in business in the next 12 months is at the highest level in 20 years13 and the number of people expecting to change jobs or seek other employment is 10% above pre-pandemic levels5.
These factors will continue to impact employers’ ability to secure the workforce they need to meet immediate and expected demand.
Demographic change presents structural challenges
The temporary impacts of the pandemic mask a deeper challenge for the Victorian economy – the share of working age Victorians is not keeping pace with the overall population. While population increases fuel growth and employment demand, a decreasing proportion of individuals aged between 15 and 64 are available to meet this demand.
In 2021, the number of non-working age people relative to working aged people was 52.5 to 100. This is expected to increase year-on-year to a high of 56.6 in 2050 (refer Figure 5).14 In regional areas the gap is larger, with the number of non-working age people relative to working aged people growing substantially, from 65.7 to 100 in 2022 to 73.6 to 100 in 2050.
These increasing dependency ratios indicate fewer individuals available to do the work required to meet employment demand triggered by the overall population. They also indicate that those outside of working age – either children and young people and retirees – typically need higher levels of support, either in education or health and aged care.
References
4 Australian Bureau of Statistics (ABS) 2022, Regional population, Population components by LGA, 2016–17 to 2020–21, reference period 2020–21 financial year, released March 2022, ABS, Canberra
5 Australian Bureau of Statistics (ABS) 2022, Regional population, Population components by LGA, 2016–17 to 2020–21, ABS, Canberra.
6 Department of Environment, Land, Water and Planning (DELWP) 2021, Victoria in future 2019(opens in a new window) population projections, DELWP, Melbourne.
7 Australian Bureau of Statistics 2022, National, state and territory population, reference period September 2021, released March 2022, ABS, Canberra.
8 Herald Sun News, Daily case numbers drop as Omicron peaks, 2022.
9 Guardian News, A game of Russian roulette Victoria’s Alfred hospital expects 15% staff absent at COVID peak, 2022.
10 The Conversation, COVID will soon be endemic. This doesn’t mean it’s harmless or we give up, just that it’s part of life, 2022.
11 Australian Bureau of Statistics 2022, Participation, Job Search and Mobility, Australia, cat.no. 6223.0, reference period February 2022, released May 2022, ABS, Canberra.
12 Australian Bureau of Statistics 2022, Insights into job mobility from quarterly Labour Force Statistics, released March 2022, reference period February 2022, ABS, Canberra.
13 Australian Bureau of Statistics (ABS) 2022, Labour Force, Australia, Detailed, Table 17, reference period March 2022, released April 2022, ABS, Canberra.
14 Australian Bureau of Statistics, National, state and territory population, reference period June 2021, released December 2021, ABS, Canberra.
Workforce challenges are likely to persist
The growing demand for workers coupled with the current constraints on workforce availability is resulting in strong competition for workers, occupational shortages across many industries and other challenges for businesses and communities. These impacts are more acute in regional areas and industries that have historically relied heavily on migrants to meet demand.
Workforce growth is required to meet demand
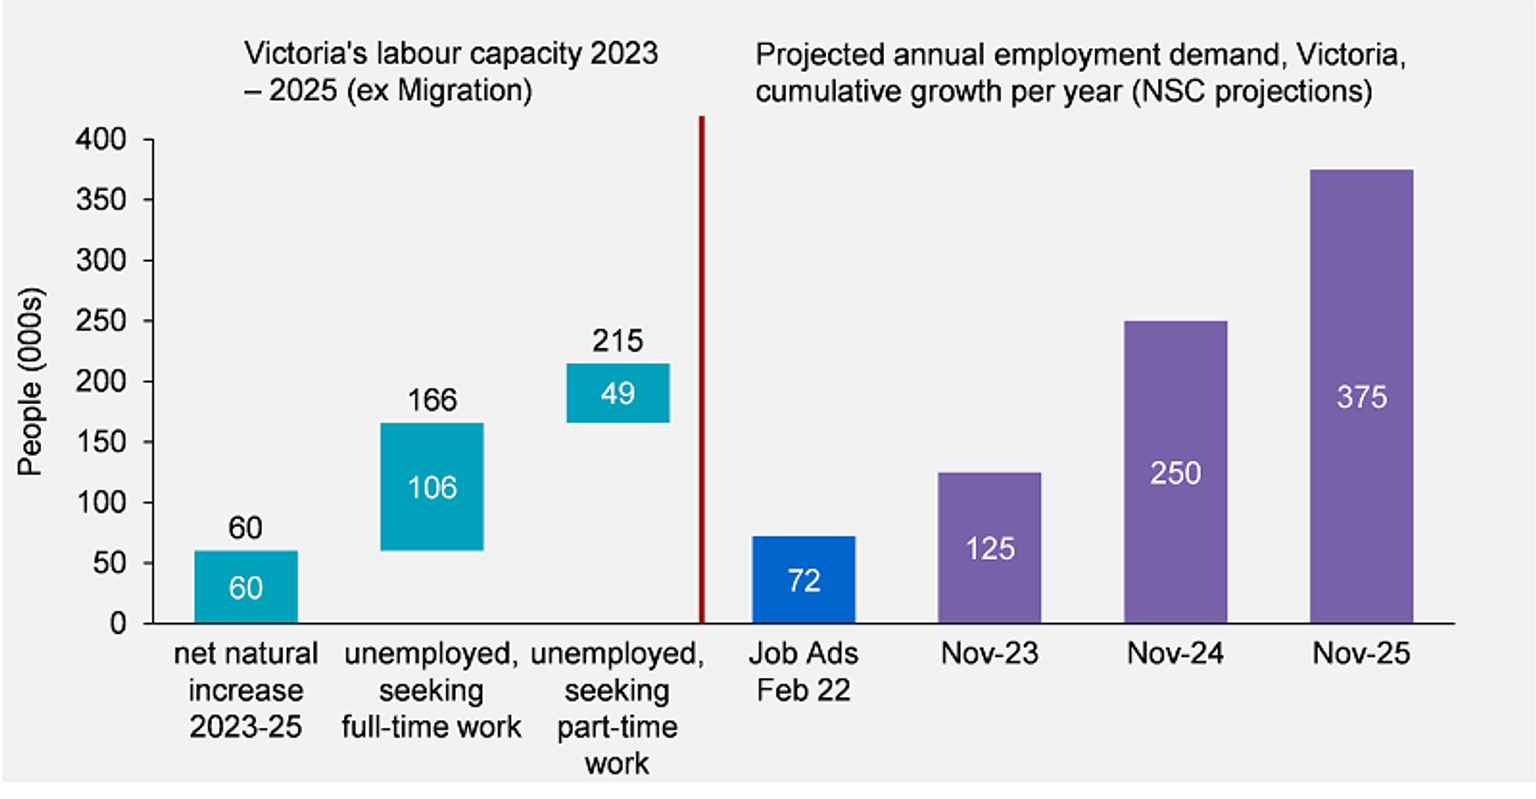
In February 2022 industry had approximately 72,400 vacancies, triggered in part by the rebuilding of workforces following 2 years of work disruption.15 Vacancy rates are expected to ebb and flow as absenteeism plays out over the next 12 to 18 months. The shortfall on current forecasts to 2025 is still likely even accounting for natural population growth, having unemployed people who want to work into jobs and the resumption of migration (refer Figure 6).
The challenges for industry cannot be overstated. Competition for labour will persist and be particularly pervasive in industries that are predicted to have the highest employment growth – health care, education and training and arts and recreation services. Industries such as retail, hospitality and agriculture have also experienced ongoing difficulties sourcing workers in recent years, compounded by the pandemic.
Occupational shortages are common across all industries
A total of 143 unique occupations are in shortage across all Victorian industries‡.17 Along with a widespread lack of potential workers, industry identified low training completion rates and challenges with attraction and retention of staff as contributing to increased difficulties meeting workforce demand.
In Victoria, the construction industry is experiencing the highest number of shortages, which includes electricians, landscapers and plumbers, followed by the services industry, which is requiring, among others, more bar staff, hotel and motel managers, and retail attendants (refer Figure 7). The health and community services industry is also facing widespread shortages, with aged and disabled carers, general practitioners (particularly in regional and remote areas), and social workers among approximately 15 unique occupations desperately needed to meet current demand. There are many other occupations that work across multiple industries that are in shortage, such as software and applications programmers.
Businesses experiencing workforce shortage also report a lack of candidates with the required skills or experience. This contributes to pockets of acute skills shortages, rather than across the labour market. Employers in these circumstances, and needing to change business models rapidly to respond to the pandemic, report it to be more cost effective to upskill existing staff who have valuable corporate knowledge and cultural capital than recruit new staff18.
Employers highlighted the inability to secure staff is likely to affect ongoing business operations. Reduced operating hours will hurt business viability and their ability to project an attractive proposition to prospective workers.
Workforce challenges are most acute in regional areas
Workforce challenges are not new to regional areas. While unemployment rates have consistently been below metropolitan Melbourne (refer Figure 8),19 industry growth is impacted by a lack of available workers. For many regions unemployment has now hit record lows.
Shortages are identified across all industries, with vacancies now increasing for many as they are unable to fill existing positions. Specialist jobs are difficult to fill, and some workers need to work across several roles.
Regional consultations highlighted the significance of anchor occupations in keeping industries going, whether it is specialist roles for health services or trades for building and construction.
While several areas of regional Victoria have experienced population growth since the pandemic, securing the pipeline of workers will continue to prove challenging. Students completing school often leave their community in pursuit of education and other employment opportunities, contributing to the ongoing trend of an ageing population and increasing dependency ratios. Government initiatives driving the growth of regional economies will need to consider housing, transport and connectivity, care and education as part of the mix in building thriving communities that attracts skilled workers and their families to relocate.
References
2 Australian Bureau of Statistics 2022, Labour Force, Australia, Detailed, cat.no.6291.0.55.001, reference period March 2022, released April 2022, ABS, Canberra.
3 Nous (2022), modelling of National Skills Commission (2022) Employment Projections 2022–2025.
15 Victorian Skills Authority (VSA) analysis of National Skills Commission Internet Vacancy Index, 2022.
‡ A shortage exists when employers are unable to fill or have considerable difficulty filling vacancies for an occupation at current levels of remuneration and conditions of employment, and in reasonably accessible locations.
16 Nous analysis of Australian Bureau of Statistics 2022, national, state and territory population, reference period September 2021, released March 2022 and VSA, Deloitte Access Economics and Nous (2022), Retirement projections 2022–2025.
17 National Skills Commission Skills Priority List; Skills Plan consultation.
18 White, I & Rittie, T, Upskilling and reskilling: the impact of the COVID-19 pandemic on employers and their training choices, 2022, National Centre for Vocational Education Research (NCVER), Adelaide.
19 National Skills Commission (NSC) 2022, Small area labour markets, reference period December 2021, released March 2022, NSC, Canberra.
Participation and productivity can drive future prosperity
Higher participation and productivity can help to address skill shortages, get more value out of employment, raise incomes and grow the Victorian economy.
Barriers to participation persist for key groups and will take time to address. Changes to business models and practices are needed to lift productivity and address workforce constraints.
Higher participation by key groups can help meet demand
Labour force participation has steadily grown over the past 30 years in Victoria. Over this period the participation rate has lifted from around 62% to around 67% , a record high.20 While workforce participation has increased, there is room for further growth.
In March 2022 there were an estimated 1.75 million people not in the labour force, with only 876,000 permanently not intending or unable to work.2 Of the remaining 899,000, an estimated 195,600 wanted to work, are available within 4 weeks but are not actively looking.21
Further, in April 2022, 222,600 people were underemployed, and these workers indicated a preference to work an additional 3,031,700 hours – equivalent to almost 7,000 full-time jobs.22
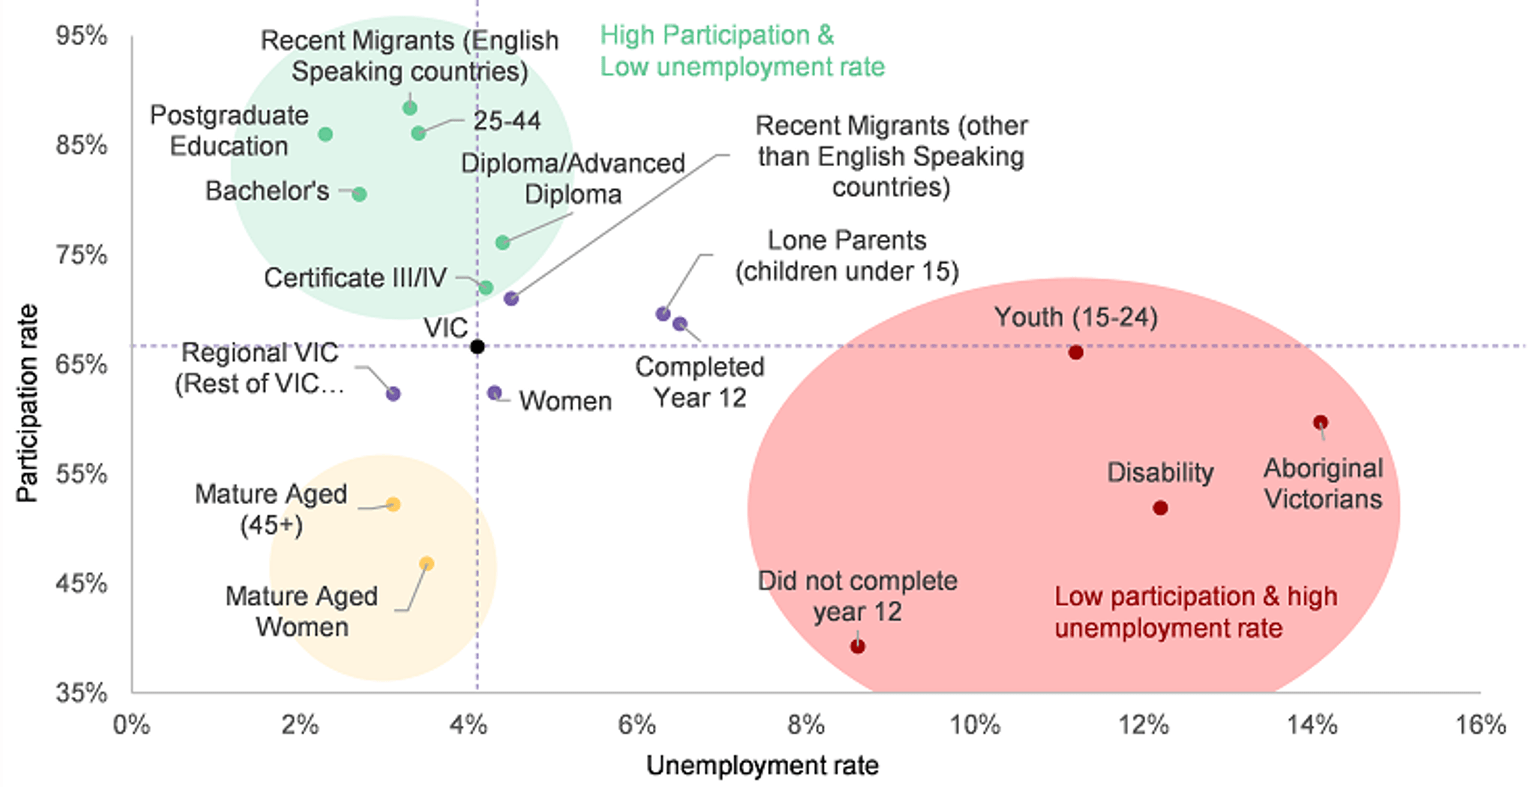
Lifting participation will not be easy. Structural barriers to learning and work prevent people from securing a job, with some communities more impacted than others. Analysis shows that Aboriginal Victorians, early school leavers, and people with disability are more likely to be unemployed or stop looking for work (refer Figure 9)23. When they do find work, it is often lower paid, precarious and casualised, with greater risk of losing their job.
At the regional level, participation rates in education and employment lag metropolitan Melbourne. Low education levels are one factor, but the availability of housing, transport and childcare create barriers to taking up education and work that are not easily overcome.
There is a particular challenge to ensure young people are supported to engage in the labour market. Successful completion of secondary school is a predictor of post-school outcomes, with learners who do not complete Year 12 – 4 times more likely not to be in work, education or training
Female participation has risen from 52% in 1992 to a record high of around 62% in 2022, driving individual, familial, and societal economic prosperity. In that time male participation dropped from 74% to around 72% today, continuing a trend of decline24.
A gap remains in the skills, occupation and labour market outcomes for women compared to men. Women typically occupy more casual and at-risk roles than men and earn less money. For example, the Australian Bureau of Statistics estimates for Victoria that on average men earn 42% more than women.
More diverse workforces can support industry productivity and innovation. It requires industry to harness the varied experiences and ideas of previously under-represented cohorts and include them in decision making systems and processes. In turn, it signals opportunity to people who may have previously thought they would not be afforded a decision-making role purely because of their identity25.
Barriers to participation
Many of the people who are currently outside the workforce face structural barriers to participating in training and work. Intergenerational poverty, trauma and discrimination, and low levels of education limit an individual's ability to engage with, and stay in, training and work. Health or mental health issues, family violence issues, and caring responsibilities add further barriers to participation.
Consultation highlighted that many people face multiple, compounding barriers. For example, a person with disability who has low levels of education will likely find it much harder to access and stay in training and work. People living in regional areas with poor access to transport and childcare, and low digital connectivity, are also more likely to have increased levels of disadvantage.
These experiences often lead to low confidence and motivation that can be associated with long-term unemployment or poor experiences in prior learning.
The pandemic has created and accelerated structural change. Some industries have more rapidly escalated their technological and digital development creating changed job roles and new job opportunities. Unfortunately, displaced workers from other industries do not always have the digital skills needed to take up these jobs.
Productivity growth is essential to future success
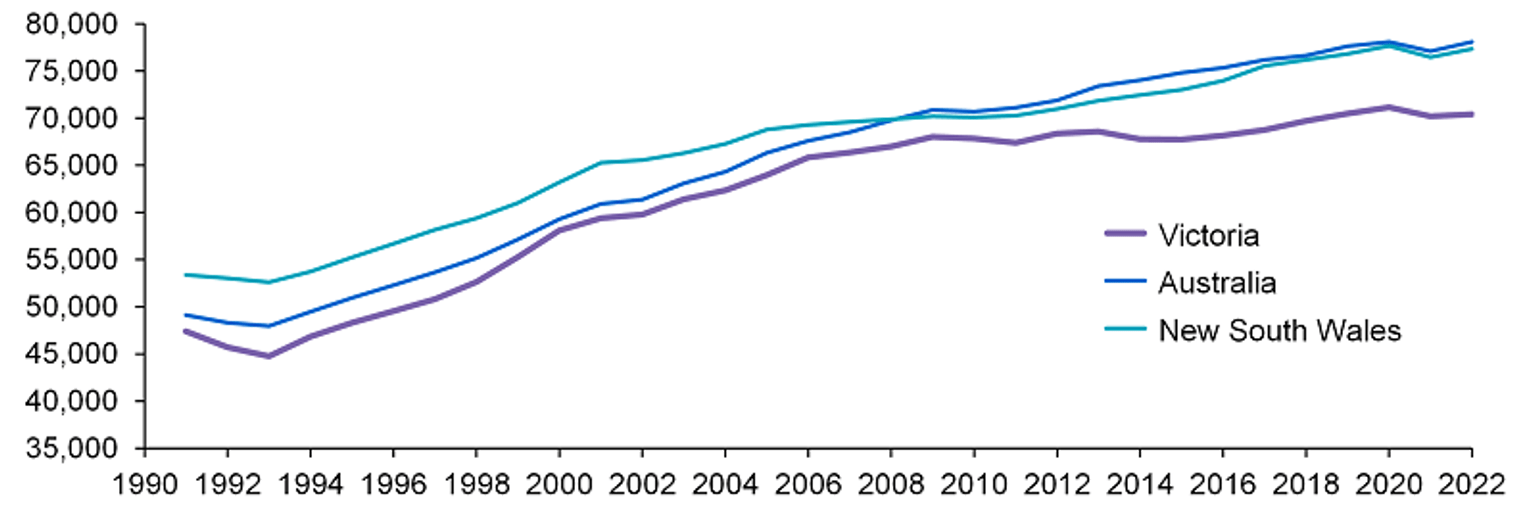
National productivity performance has increased over the decades and Australia sits in the middle of OECD rankings1. However, since 2013, Victoria’s Gross State Product (GSP) per capita has been below the Australian average (refer Figure 10).7, 26 While some factors may be structural, it is likely that opportunities exist to support businesses to adopt new business models, practices, and technology to increase productivity and ease demand for labour.
Businesses are rising to the challenge. Across Victoria, innovation is driving new business activity and requires different and higher-level skills – whether related to technology or new practices for businesses to remain competitive. Rapid technological change means most people will be regularly expected to develop new knowledge, conduct new tasks, solve more complex and interconnected problems, interact with digital tools and artificial intelligence, and engage with customers in new ways. Many specialised activities will also be required to comply with international standards operating in globally connected supply chains.
The health and community services industry are at the forefront of thinking differently about their workforce to meet demand. Significant government reform in disability, aged care, mental health and family violence is re-positioning service delivery to be more person centred. Workers will be required to be increasingly multi-skilled into the future whilst also being required to work across different sub sectors as the people they serve present with intersectional care challenges27.
Workers need new skills to remain relevant in their role and support business growth. They also need new skills to effectively take up emerging jobs. This occurs when new business practices generate new occupational needs that vary greatly from existing occupations, requiring a new set of skills entirely. This process is essential to attract investment and support sustained business growth.
The past 2 decades have observed a growing demand for higher order skills. Occupations classified at ANZSCO skill level 1, 2 or 3 or those commensurate with higher level VET and higher education now account for around 60% of the workforce compared to 57% a decade ago28. Occupations commensurate with a bachelor’s degree or higher qualification had the highest increase in share, with more jobs added in the last decade than the other 4 categories combined.‡
However, this only provides part of the story. Industry is increasingly looking to higher order skills across all occupations. Agriculture, manufacturing, and services are just some examples where higher order skills are required by businesses as they seek to automate repetitive work and focus on higher value add activities in order to compete at a local and international level.
This shift is across all roles regardless of prior education or experience, impacting individuals at the start, middle and end of their career. A tight labour market will accelerate this shift as workers become harder to find and retain, driving further adoption of higher order skills. Victoria as a knowledge economy has long recognised the value of skills. Victorians on average are more likely to be enrolled in study29, more educated30, and employed in more highly qualified occupations than most jurisdictions. Investing in the development of new skills has significant returns on investment. Every 1% improvement in productivity across Victoria is the equivalent to the work of approximately 35,000 individuals.31 These benefits can be shared with investors, business owners, employees, and the broader community.
Continued productivity growth requires continuous learning. This is illustrated in a recent survey of businesses of which 83.8% indicated they believed they had the skills they need to function today whereas only 79.2% indicated they expect to have the skills they need to function in the next 12 months35. The changing nature of skills requires retraining yet only 60.6% of employers indicated they supported staff training in the past 12 months, either by paying for the training or providing staff with the time off to engage in the learning.
Ultimately, in a tight labour market, the quality of jobs is critical to individuals. ‘Better work’ looks like higher skill, pay, job satisfaction, security and long-term resilience. Higher productivity is the key to delivering this.
References
20 Australian Bureau of Statistics (ABS) 2022, Labour force, Australia, reference period April 2022, released May 2022, ABS, Canberra.
2 Australian Bureau of Statistics (ABS) 2022, Participation, Job Search and Mobility, cat.no. 6291.0.55.001, reference period March 2022, released April 2022, ABS, Canberra.
21 Australian Bureau of Statistics (ABS) 2022, Labour Force, Australia, Detailed, cat.no.6202.0 and 6291.0.55.01, reference period March 2022, released April 2022, ABS, Canberra.
22 Australian Bureau of Statistics (ABS) 2022, Labour Force, Australia, Detailed, cat.no.6202.0 and 6291.0.55.01, reference period March 2022, released April 2022, ABS, Canberra.
23 Australian Bureau of Statistics (ABS) 2022, Labour force, Australia, ABS, Canberra, viewed 3 May 2022, available here. Data current as at March 2022 unless otherwise stated. Where seasonally adjusted data is not reported by ABS a 3-month moving average is calculated. A 12-month moving average is applied for Youth (15-24). Aboriginal Victorians is based on ABS Census 2016. Disability is based on ABS Disability, Ageing and Carers (2018). Highest level of educational attainment is based on quarterly data reported by ABS as at February 2022
24 Australian Bureau of Statistics 2022, Labour force, Australia, cat.no. 6202.0, ABS, Canberra, viewed 3 May 2022.
25 Ely, R and Thomas, D, Getting serious about diversity: enough already with the business case, 2020, Harvard Business Review.
1 Australian Government Productivity Commission, PC Productivity Insights, March 2022
7 Australian Bureau of Statistics 2022, national, state and territory population, reference period September 2021, released March 2022, ABS, Canberra. Available at Australian Bureau of Statistics.
26 Australian Bureau of Statistics (ABS) 2021, Australian national accounts: state accounts, reference period 2020–21 financial year, released November 2021, ABS, Canberra.
27 Victorian Skills Authority, Victorian Skills Plan – Health and Community Services Industry Insight, May 2022
28 Nous analysis of Australian Bureau of Statistics (ABS) 2022, Labour Force Survey, Australia, released April 2022, ABS, Canberra.
‡ In ANZSCO, skill level is defined as a function of the range and complexity of the set of tasks performed in a particular occupation. The greater the range and complexity of the set of tasks, the greater the skill level of an occupation. ANZSCO has 5 skill levels, with Skill Level 1 defined as having a level of skill commensurate with a bachelor degree or higher qualification and Skill Level 5 having a level of skill commensurate to Australian Qualification Framework Certificate 1 or compulsory secondary education.
29 Australian Bureau of Statistics 2021, Education and work, Table 11, Persons aged 15-64, electronic dataset, ABS, Canberra.
30 Australian Bureau of Statistics 2021, Education and work, Table 29, electronic dataset, ABS, Canberra
31 Nous analysis of Australian Buraru of Statistics 2022, Labour Force, Australia, Detailed, cat.no.6291.0.55.001, reference period March 2022, released April 2022, ABS, Canberra
32 Australian Bureau of Statistics 2021, Education and work, Table 11, Persons aged 15-64, electronic dataset, ABS, Canberra.
33 Australian Bureau of Statistics 2021, Education and work, Table 29, electronic dataset, ABS, Canberra
34 Nous analysis of Australian Bureau of Statistics 2022, Labour Force, Australia, Detailed, cat.no.6291.0.55.001, reference period March 2022, released April 2022, ABS, Canberra
35 Wallis Social Research, Victorian Employer Skills Survey, Q5a an Q5b, n= 9935, 2021
Appendix 1: Industry summaries
References figure 11
Industries are informed by the ABS ANZSIC classification. All data is estimated and no definitive and doesn't take into account current vacancies or broader exits from industry.
Number have been rounded to account for likely differences.
Sources
1. ABS Labour Force Survey, February 2022
2. VSA and Shah Consulting (2022) analysis of Nous, NSC and ABS data
3, 4 and 5 National Skills Commission employment projections, Nous and VSA analysis, (2022)
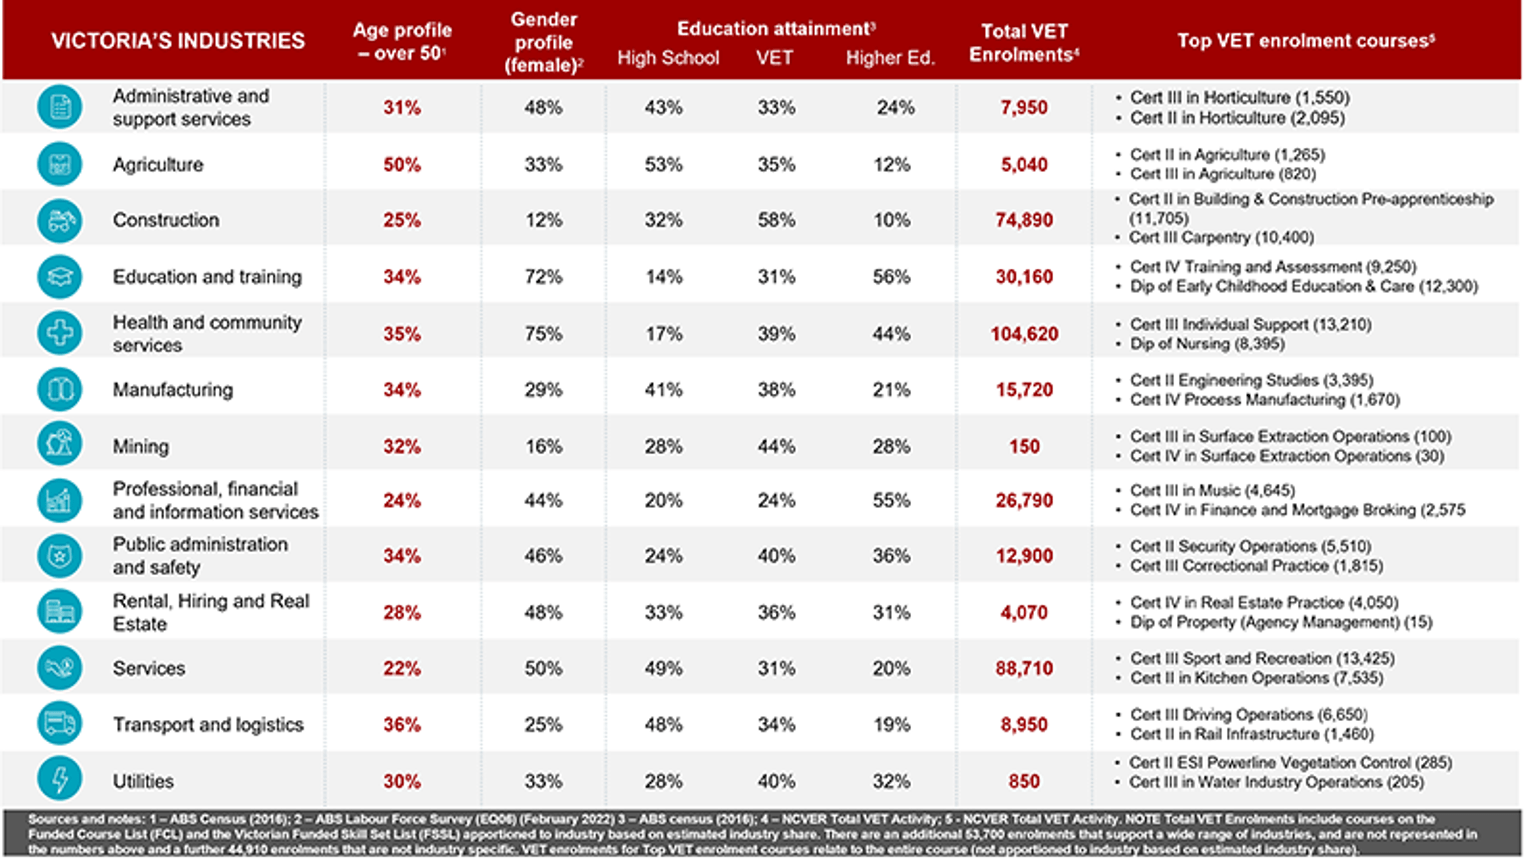
References figure 12
Sources and notes
1 ABS Census (2016)
2 ABS Labour Force Survey (EQ06) (February 2022)
3 ABS Census (2016)
4, 5 NCVER Total VET Activity
Note: total VET enrolments include courses on the Funded Course List (FCL) and the Victorian Funded Skill Set List (FSSL) apportioned to industry based on estimated industry share. There are an additional 53,700 enrolments that support a wide range of industries, and are not represented in the numbers above and a further 44,910 enrolments that are not industry specific. VET enrolments for top VET enrolment courses relate to the entire course (not apportioned to industry based on estimated industry share).
Appendix 2: Regional summaries
Sources and notes figure 13
Regions are defined by the Department of Jobs, Skills, Industry and Regions Regional Partnerships.
All data is estimated and not definitive.
Numbers have been rounded to account for likely differences.
References
1. National Skills Commission
2. VSA and Shah Consulting (2022) analysis of Nous, NSC and ABS data
3, 4. VSA and Nous modelling of NSC (2022) Employment Projections.
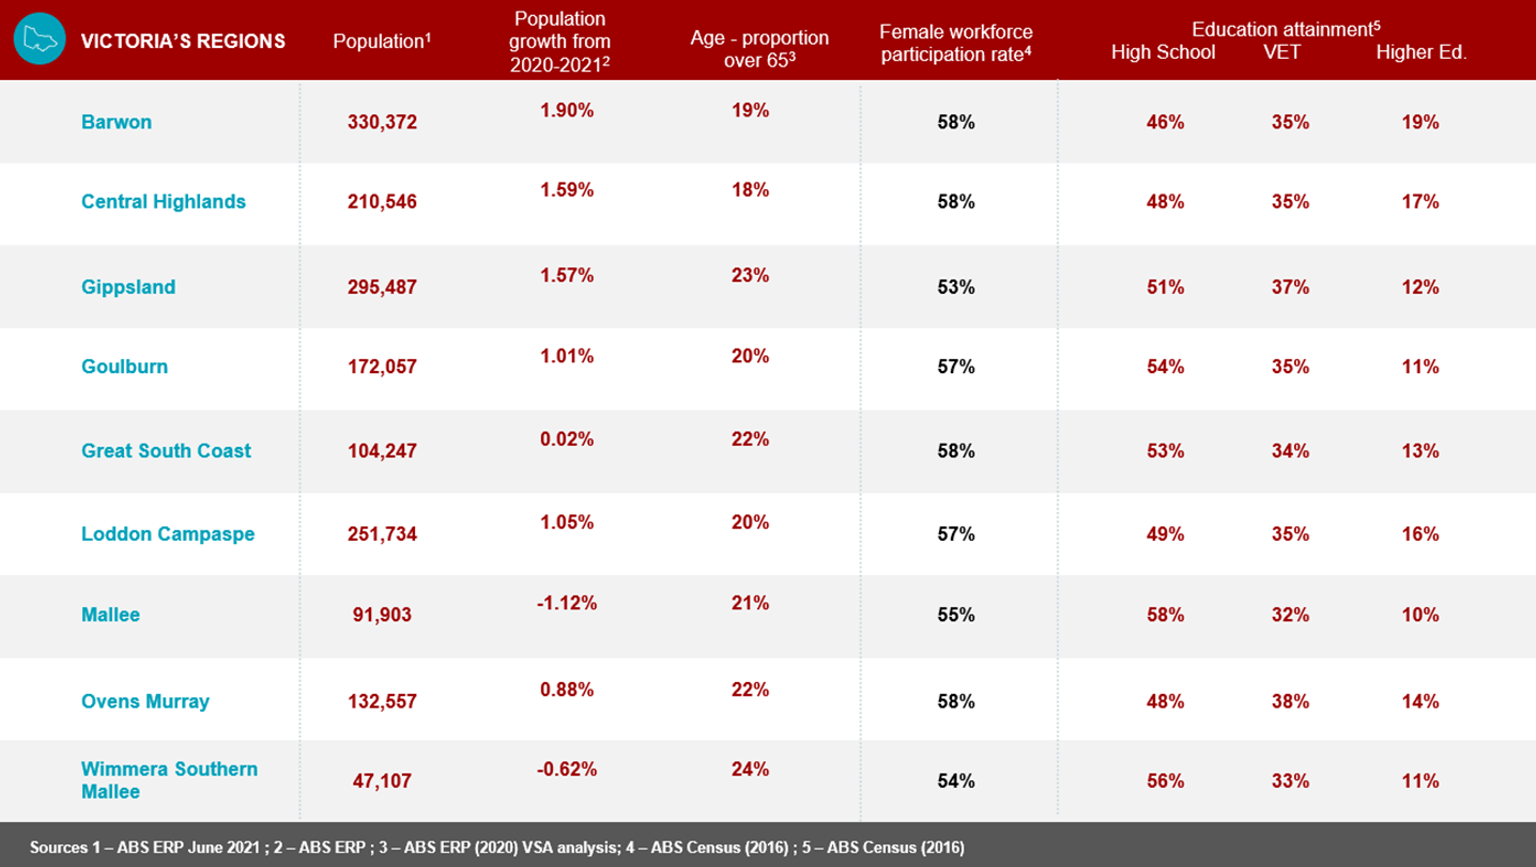
Sources and note figure 14
1. ABS ERP June 2021
2. ABS ERP
3. ABS ERP (2020) VSA analysis
4. ABS Census (2016)
5. ABS Census (2016)


